
Introduction:
Price Action Trading is one of the most popular trading methods used by professional Forex traders worldwide. Unlike strategies that rely heavily on technical indicators, Price Action Trading focuses on analyzing the movement of price itself. By studying candlestick patterns, market structure, support and resistance levels, and overall price behavior, traders can make informed decisions without cluttering their charts with numerous indicators. Before learning Price Action Trading, it’s helpful to understand the basics of chart analysis. If you’re new to Forex, start with our comprehensive guide on What Is Technical Analysis? A Beginner’s Guide to Reading Forex Charts.
Every movement in the Forex market represents a battle between buyers and sellers. Price Action Trading helps traders understand this battle by observing how price reacts at important market levels. Instead of relying on lagging indicators that interpret historical data, price action provides real-time information about market sentiment.
One of the biggest advantages of Price Action Trading is its simplicity. A clean chart with only candlesticks and key support and resistance levels often provides enough information for experienced traders to identify potential buying and selling opportunities. This approach allows traders to focus on what truly matters: the actual movement of the market.
Price Action Trading is suitable for traders of all experience levels. Whether you are a beginner opening your first demo account or an experienced trader looking to simplify your strategy, understanding price action can significantly improve your ability to read Forex charts.
In this comprehensive beginner’s guide, you will learn what Price Action Trading is, how it works, why professional traders prefer it, and how to use it effectively in your daily Forex trading. You’ll also discover practical examples, common mistakes to avoid, and tips to help you build confidence in reading market movements.
What Is Price Action Trading?
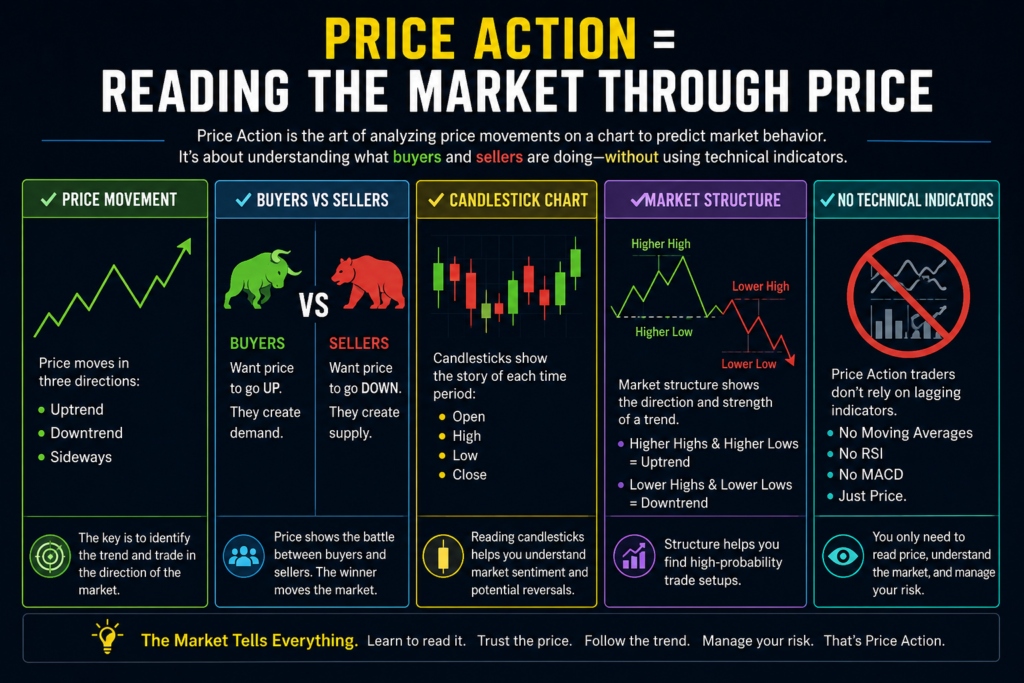
Price Action Trading is a trading strategy that involves making trading decisions based solely on the movement of price on a chart. Rather than depending on indicators such as the Moving Average, RSI, MACD, or Bollinger Bands, price action traders analyze candlestick formations, market trends, support and resistance levels, and overall market structure to identify trading opportunities. If you’re new to Forex trading and want to deepen your understanding of Price Action Trading, BabyPips offers beginner-friendly educational lessons that explain market structure, candlestick analysis, and trading psychology in simple terms.
The concept is simple: price reflects everything that is happening in the market. Economic news, trader emotions, institutional buying and selling, and market expectations are all reflected in the movement of price. By learning to interpret these movements, traders can gain valuable insights into where the market may move next. Many Price Action traders rely on candlestick formations to understand market sentiment. Learn how to recognize the most important setups in our guide on Top 11 Candlestick Patterns Every Forex Trader Should Know.
Imagine watching an auction where buyers compete to purchase an item while sellers try to sell at the highest possible price. The constant interaction between buyers and sellers determines the final selling price. The Forex market operates in much the same way. Price constantly changes as buyers and sellers react to economic events, technical levels, and market sentiment.
Price Action Trading allows traders to observe this interaction directly. Instead of waiting for indicators to confirm a signal after the price has already moved, traders can identify opportunities as they develop in real time.
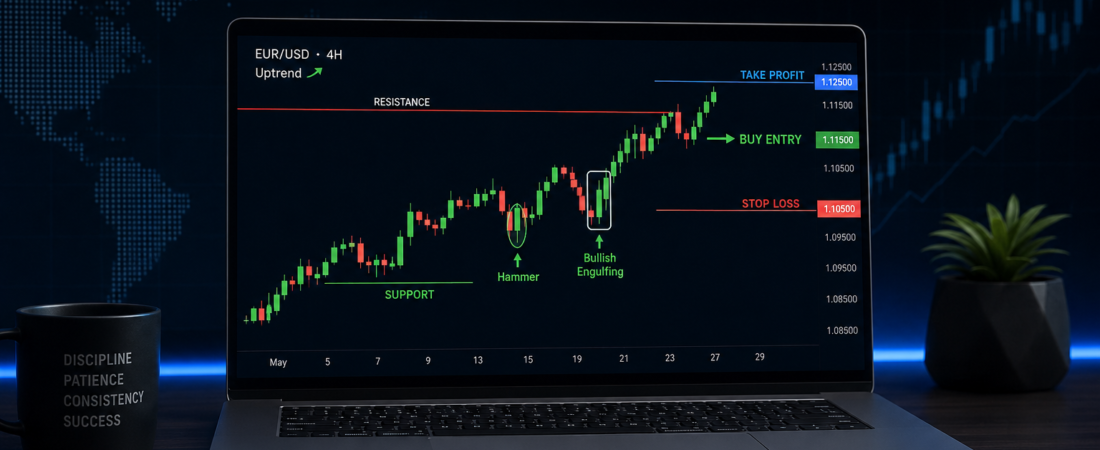
For example, suppose the EUR/USD currency pair reaches a strong support level where buyers have previously entered the market. If a bullish candlestick pattern such as a Hammer or Bullish Engulfing forms at that level, a Price Action trader may interpret this as a sign that buyers are taking control and consider entering a buy trade.
Similarly, if price reaches a resistance level and forms a bearish candlestick pattern like a Shooting Star or Bearish Engulfing candle, the trader may anticipate a downward movement and prepare for a sell position.
This ability to interpret price movements without relying heavily on technical indicators makes Price Action Trading one of the most flexible and widely respected trading approaches in the Forex market.
How Price Action Trading Works
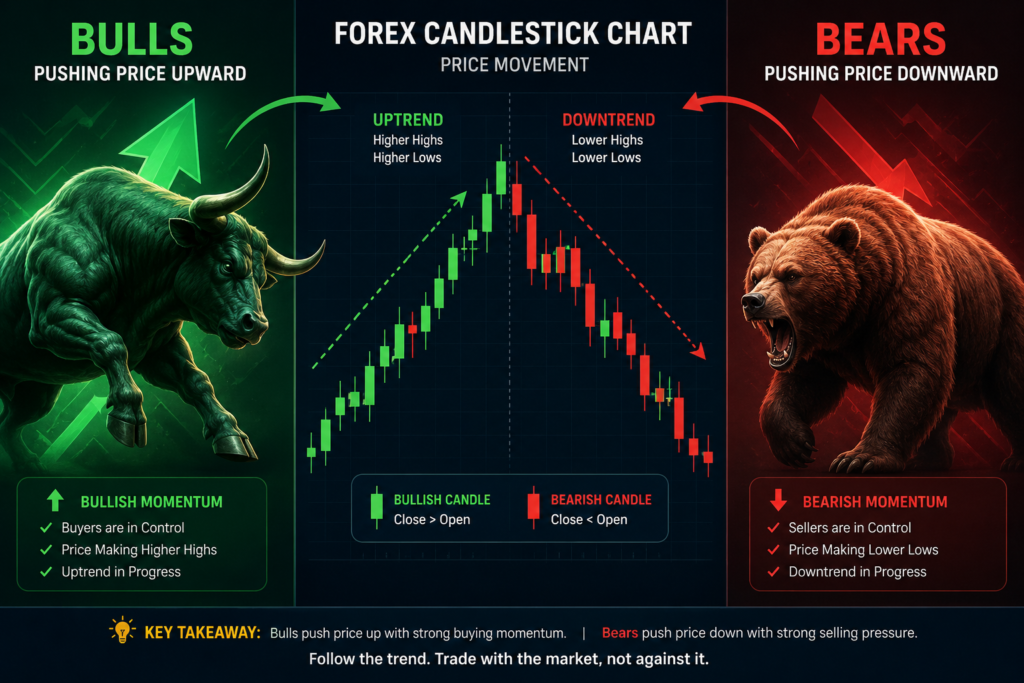
Price Action Trading is based on one simple principle: every movement in the market tells a story. Instead of relying on technical indicators to generate buy or sell signals, traders observe how price behaves around important market levels and use that information to make trading decisions.
Every candlestick on a Forex chart represents the ongoing battle between buyers (bulls) and sellers (bears). When buyers are stronger, prices rise. When sellers dominate, prices fall. Price Action traders study this constant interaction to determine which side currently has control of the market.
Unlike indicators that calculate information from past price movements, price action focuses on what the market is doing right now. This allows traders to react to changing market conditions more quickly.
For example, imagine the EUR/USD currency pair has been rising steadily for several days. As the price approaches a major resistance level, buyers begin to slow down while sellers enter the market. A large bearish candlestick forms, followed by another strong bearish candle.
A Price Action trader sees these changes as signs that buying pressure is weakening and selling pressure is increasing. Instead of waiting for an indicator to confirm the reversal, the trader can use the price movement itself as confirmation.
This is why many experienced traders describe price action as “reading the language of the market.”
Understanding Market Psychology
Every price movement is influenced by human emotions.
Thousands of traders around the world are constantly making decisions based on:
- Fear
- Greed
- Hope
- Confidence
- Uncertainty
These emotions are reflected directly in price movements.
For example:
When traders become optimistic about a currency, buying pressure increases and prices rise.
When traders become fearful due to negative economic news, selling pressure increases and prices decline.
Price Action Trading helps traders recognize these emotional shifts by observing how price behaves around important market levels.
Instead of trying to predict the future, Price Action traders react to what the market is already communicating.
Understanding market psychology allows traders to make more informed decisions while avoiding emotional trading themselves.
The Four Components of Price Action Trading
Successful Price Action Trading relies on four major components.
Understanding each of these concepts will significantly improve your ability to analyze Forex charts.
1. Market Structure
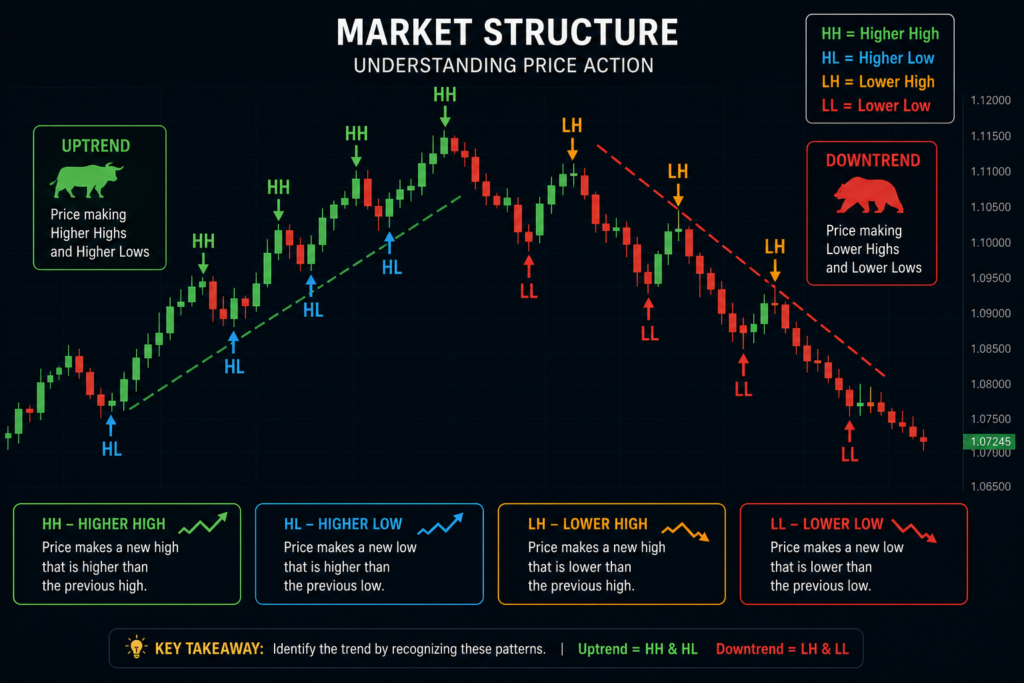
Market structure refers to the overall direction of the market. Understanding the overall trend is one of the foundations of Price Action Trading. Read our Trend Trading for Beginners: How to Follow Market Direction guide to learn how to identify strong market trends.
Price generally moves in one of three directions:
- Uptrend
- Downtrend
- Sideways (Range)
Recognizing market structure helps traders avoid trading against the dominant market direction.
Uptrend
An uptrend occurs when price continues making:
- Higher Highs (HH)
- Higher Lows (HL)
This indicates that buyers remain in control.
Example:
Higher High

      ▲

Higher Low

      ▲

Higher High

      ▲

Higher Low
In an uptrend, traders usually look for buying opportunities.
Downtrend
A downtrend occurs when price continues making:
- Lower Highs (LH)
- Lower Lows (LL)
This indicates increasing selling pressure.
Example:
Lower High

      ▼

Lower Low

      ▼

Lower High

      ▼

Lower Low
During a downtrend, traders generally focus on selling opportunities.
Sideways Market
Sometimes price moves neither upward nor downward.
Instead, it remains trapped between support and resistance.
This is known as a ranging market.
During these periods:
- Buyers dominate near support.
- Sellers dominate near resistance.
Price Action traders often wait for a breakout before entering new positions.
2. Support and Resistance
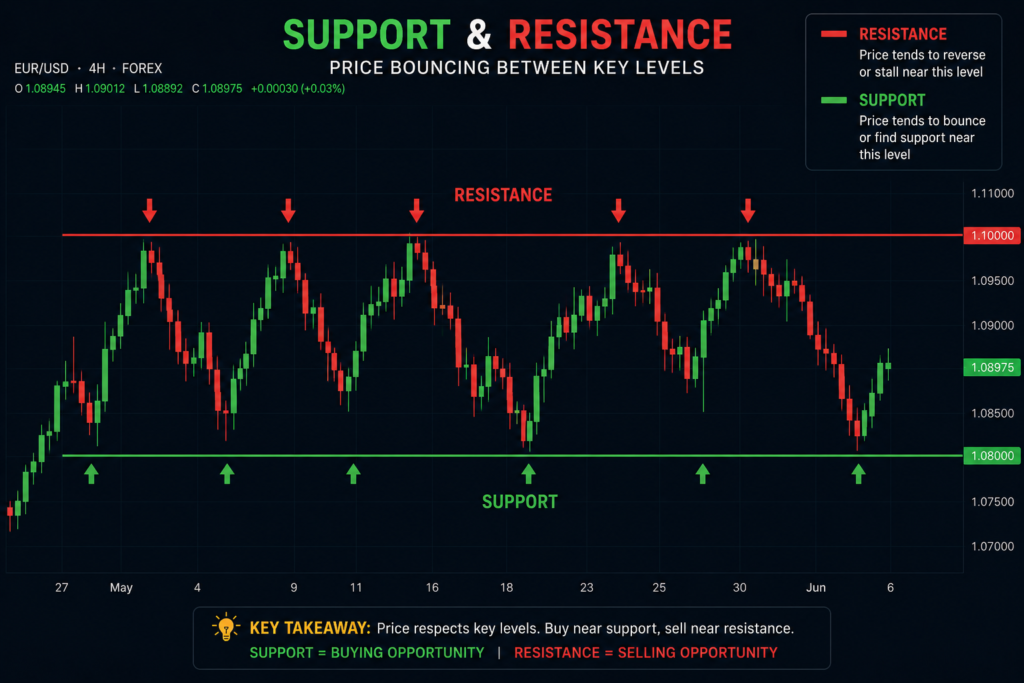
Support and resistance are among the most important concepts in Price Action Trading. Support and resistance levels become much more powerful when combined with Price Action signals. Learn how to draw these key levels accurately in our Support and Resistance in Forex Trading for Beginners guide.
Support
Support is a price level where buying pressure is strong enough to stop prices from falling further.
As price approaches support:
- Buyers become active.
- Selling pressure weakens.
- Price often bounces upward.
Example:
EUR/USD falls several times to 1.0850.
Each time, buyers enter the market and push prices higher.
This creates a strong support level.
Resistance
Resistance is the opposite of support.
It is a price level where selling pressure becomes strong enough to prevent prices from moving higher.
As price approaches resistance:
- Sellers enter the market.
- Buying pressure weakens.
- Price often reverses downward.
Example:
GBP/USD repeatedly reaches 1.3050 before falling.
This becomes a major resistance level.
Price Action traders often wait for confirmation before trading around these important zones.
Internal Link Opportunity: Support and resistance become even more powerful when combined with price action. Learn more in our guide on Support and Resistance in Forex Trading for Beginners.
3. Candlestick Patterns
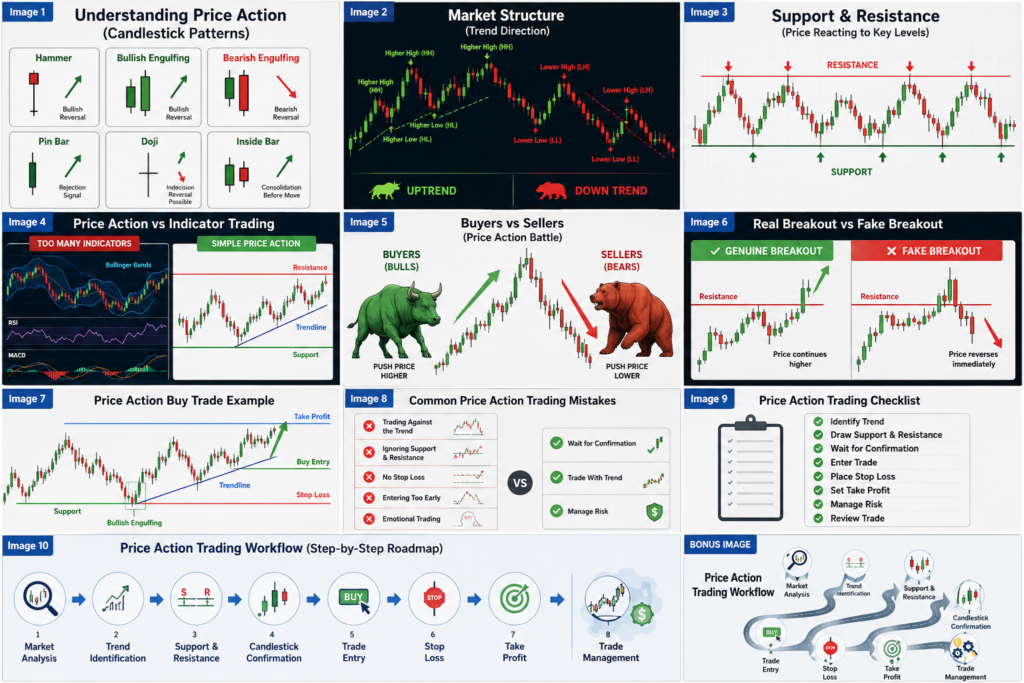
Candlestick patterns provide valuable clues about market sentiment. Mastering candlestick patterns will significantly improve your Price Action Trading skills. Explore our detailed guide on Top 11 Candlestick Patterns Every Forex Trader Should Know.
They help traders understand whether buyers or sellers currently have control.
Some of the most reliable Price Action candlestick patterns include:
- Hammer
- Bullish Engulfing
- Bearish Engulfing
- Shooting Star
- Doji
- Inside Bar
- Pin Bar
For example:
A Hammer forming at a strong support level often signals that buyers are stepping back into the market.
A Bearish Engulfing pattern near resistance may indicate that sellers are gaining control.
However, no candlestick pattern should be traded in isolation.
Professional traders always combine candlestick patterns with:
- Trend analysis
- Support and resistance
- Market structure
- Risk management
Learn how these patterns work in our detailed guide on, Top 11 Candlestick Patterns Every Forex Trader Should Know.
4. Trend Analysis
One of the golden rules of Price Action Trading is:
The trend is your friend.
Many beginner traders lose money because they constantly try to trade against the trend.
Professional traders prefer to trade in the same direction as the overall market.
For example:
If EUR/USD has been making Higher Highs and Higher Lows for several weeks, buying opportunities generally have a higher probability of success than selling opportunities.
Trading with the trend improves consistency and reduces unnecessary risk.
Internal Link Opportunity: Read our beginner’s guide on Trend Trading for Beginners: How to Follow Market Direction to learn how to identify trends more accurately.
Why Many Professional Traders Prefer Price Action
Price Action Trading has become one of the most respected trading approaches because it focuses on the most important piece of information available, the price itself.
Instead of relying on multiple indicators that may produce conflicting signals, traders analyze the raw movement of the market.
Some of the biggest advantages include:
Simplicity
Price Action charts are clean and easy to read.
Without numerous indicators covering the chart, traders can focus entirely on market behavior.
Faster Decision-Making
Because Price Action responds directly to market movements, traders can often recognize trading opportunities earlier than traders waiting for indicator confirmation.
Works Across All Markets
Price Action principles apply to:
- Forex
- Stocks
- Cryptocurrencies
- Commodities
- Indices
The concepts remain the same because every financial market is driven by buyer and seller interaction.
Improves Market Understanding
Instead of simply following indicator signals, traders develop a deeper understanding of how markets behave.
This knowledge often leads to better decision-making over time.
Key Takeaways
Price Action Trading is built around understanding how buyers and sellers interact in the market. By studying market structure, support and resistance, candlestick patterns, and trend direction, traders can identify high-probability trading opportunities without relying heavily on technical indicators.
Learning to read price action takes practice, but once mastered, it becomes one of the most versatile and effective approaches to Forex trading.
Price Action Trading vs Indicator Trading
One of the most common questions beginners ask is whether they should trade using Price Action or technical indicators. While both approaches have their strengths, understanding the differences will help you choose the method that best suits your trading style. To explore the concept of Price Action Trading in more detail, you can also read Investopedia’s explanation of how traders analyze market movements using price behavior instead of relying solely on technical indicators.
Technical indicators such as the Moving Average, RSI, MACD, and Bollinger Bands analyze historical price data to generate trading signals. Price Action Trading, on the other hand, focuses directly on the movement of price without relying heavily on these indicators.
Price Action traders believe that everything affecting the market economic news, trader sentiment, institutional activity, and supply and demand—is already reflected in the price itself. By learning to interpret price movements, they can identify trading opportunities without waiting for indicators to confirm them.
Indicators are not necessarily bad. Many successful traders combine them with Price Action to increase confidence in their trading decisions. However, relying solely on indicators can sometimes lead to delayed signals because indicators react to price movements rather than predict them.
Comparison Table
| Price Action Trading | Indicator Trading |
|---|---|
| Uses raw price movement | Uses mathematical calculations |
| Clean, uncluttered charts | Charts may contain several indicators |
| Responds immediately to price | Signals often lag behind price |
| Focuses on market structure | Focuses on indicator signals |
| Excellent for understanding market psychology | Useful for confirming trends and momentum |
For beginners, learning Price Action first provides a strong foundation before adding indicators later.
The Best Price Action Trading Strategies
Price Action Trading is not a single strategy but a collection of techniques used to analyze the market. Below are some of the most effective strategies that beginner traders can start practicing.
Strategy 1: Trading with the Trend
One of the simplest and most reliable Price Action strategies is trading in the direction of the overall trend.
Remember the saying:
The trend is your friend until it bends.
If the market is making Higher Highs and Higher Lows, focus on buying opportunities.
If the market is making Lower Highs and Lower Lows, look for selling opportunities.
For example:
EUR/USD has been rising steadily over several days. Instead of trying to predict a reversal, wait for a pullback toward support. If a bullish candlestick pattern forms, this could provide a high-probability buying opportunity.
Trading with the trend increases the likelihood that the market will continue moving in your favor.
Strategy 2: Support and Resistance Bounce
Support and resistance levels often act as turning points in the market.
Rather than entering trades randomly, Price Action traders wait for price to reach these important levels before looking for confirmation.
Buy Example
- Price falls toward support.
- A Hammer candlestick forms.
- Buyers begin pushing price upward.
- Enter a Buy trade after confirmation.
Sell Example
- Price rises toward resistance.
- A Shooting Star appears.
- Sellers enter the market.
- Enter a Sell trade after confirmation.
This strategy combines market structure with candlestick confirmation to improve trade quality.
Strategy 3: Breakout Trading
Markets do not remain within support and resistance forever.
Eventually, price breaks out and starts a new trend.
A breakout occurs when price moves decisively above resistance or below support with strong momentum.
Bullish Breakout
Price repeatedly struggles to move above resistance.
Eventually, buyers become stronger.
A large bullish candle closes above resistance.
This signals that buyers may now control the market.io
Bearish Breakout
Price repeatedly bounces from support.
Eventually, sellers become stronger.
A large bearish candle closes below support.
This suggests further downside movement may follow.
However, not every breakout is genuine.
Understanding Fake Breakouts
One of the biggest challenges in Price Action Trading is distinguishing between real breakouts and false breakouts.
A fake breakout occurs when price briefly moves beyond support or resistance before quickly reversing back inside the range.
Many beginner traders enter immediately after seeing price break a level.
Professional traders usually wait for confirmation before entering.
Example
EUR/USD breaks above resistance.
Instead of continuing higher, the next candle closes back below resistance.
This indicates buyers lacked enough strength to sustain the breakout.
The market then begins falling.
Waiting for confirmation can help traders avoid unnecessary losses.
How to Enter Trades Using Price Action
Successful Price Action traders follow a structured trading process rather than entering trades based on emotion. Protecting your trading capital is just as important as finding good entries. Learn how to place Stop Loss and Take Profit levels correctly in our guide on How to Set Stop Loss and Take Profit Correctly in Forex.
Below is a simple six-step approach suitable for beginners.
Step 1: Identify the Overall Trend
Start by determining whether the market is:
- Trending upward
- Trending downward
- Moving sideways
Trading with the dominant trend generally provides higher-probability opportunities.
Step 2: Draw Support and Resistance Levels
Mark important price levels where the market has previously reversed.
These areas often attract buyers and sellers.
Step 3: Wait for Price Confirmation
Never enter a trade simply because price reaches support or resistance.
Wait for confirmation such as:
- Hammer
- Bullish Engulfing
- Bearish Engulfing
- Shooting Star
- Pin Bar
- Inside Bar
Confirmation increases the probability that your analysis is correct.
Step 4: Enter the Trade
After confirmation appears, enter the trade according to your trading plan.
Avoid chasing the market.
Patience often leads to better entries.
Step 5: Place Your Stop Loss
Every trade should include a Stop Loss.
For Buy trades:
Place the Stop Loss below support or below the confirmation candle.
For Sell trades:
Place the Stop Loss above resistance or above the confirmation candle.
Internal Link Opportunity: Learn the correct way to protect your trades in our guide on How to Set Stop Loss and Take Profit Correctly in Forex.
Step 6: Set Your Take Profit
Choose a realistic Take Profit level.
Common methods include:
- Next support or resistance level.
- Risk-to-Reward Ratio of at least 1:2.
- Previous swing high or swing low.
Never enter a trade without planning both your Stop Loss and Take Profit.
Practical Forex Trading Example
Let’s put everything together. Before entering any trade, experienced traders always check the economic calendar for major news events that could affect market volatility and Price Action.
Scenario
You are analyzing GBP/USD on the 4-hour chart. The best way to improve your Price Action Trading skills is through consistent chart practice. You can analyze live Forex charts and identify support, resistance, and candlestick patterns using TradingView.
You notice:
- The market is making Higher Highs and Higher Lows.
- Price pulls back toward a strong support level.
- A Bullish Engulfing candlestick forms.
- Trading volume increases.
Your Trade Plan
Entry Price
1.2750
Stop Loss
1.2715
Below support.
Take Profit
1.2830
Near the next resistance level.
Risk-to-Reward Ratio
1:2
This trade follows all the principles of Price Action Trading:
✔ Trend confirmation
✔ Support level
✔ Bullish candlestick pattern
✔ Proper Stop Loss
✔ Realistic Take Profit
Instead of guessing, every decision is based on what the market is showing.
Why Patience Is Essential in Price Action Trading
Many beginner traders lose money because they feel the need to be in a trade at all times.
Professional Price Action traders understand that waiting for the right setup is part of the strategy.
Sometimes the best trading decision is to do nothing until all the conditions of your trading plan are met.
Quality setups usually produce better results than taking every possible trade.
Remember:
The market will always provide another opportunity. Protecting your capital is more important than forcing a trade.
Key Takeaways
Price Action Trading is most effective when traders follow a structured process rather than reacting emotionally to every market movement. By identifying trends, marking support and resistance, waiting for confirmation, and applying proper risk management, traders can improve the quality of their decisions and build confidence over time.
Common Price Action Trading Mistakes Beginners Make
Price Action Trading is one of the most effective ways to analyze the Forex market, but many beginners make avoidable mistakes that reduce their chances of success. Understanding these common errors can help you become a more disciplined and consistent trader. Many of these mistakes can be avoided by developing patience, discipline, and emotional control. Read our article on The Psychology of a Successful Trader to learn how mindset influences trading performance.
1. Trading Every Candlestick Pattern
Many beginners believe that every Hammer, Doji, or Engulfing pattern is a trading signal.
This is not true.
Candlestick patterns should always be considered within the context of:
- The overall trend.
- Support and resistance.
- Market structure.
- Trading volume.
- Market conditions.
A Hammer appearing in the middle of a sideways market may have very little significance compared to one forming at a strong support level.
Always wait for confirmation before entering a trade.
2. Ignoring the Overall Trend
One of the biggest mistakes beginners make is trying to predict market reversals.
Instead of trading with the trend, they constantly look for opportunities to trade against it.
Professional traders understand that trading with the dominant trend generally provides higher-probability setups.
If the market is making Higher Highs and Higher Lows, focus primarily on buying opportunities.
If the market is making Lower Highs and Lower Lows, prioritize selling opportunities.
3. Trading Without Support and Resistance
Price Action Trading is not simply about recognizing candlestick patterns.
Location matters.
A Bullish Engulfing pattern occurring at a major support level is usually much more reliable than the same pattern appearing randomly in the middle of a trend.
Always identify important support and resistance levels before looking for entry signals.
4. Entering Trades Too Early
Many traders become impatient.
As soon as they think a pattern is forming, they enter the market.
Unfortunately, many candlestick patterns are not confirmed until the candle has completely closed.
Professional traders wait for confirmation before risking their money.
Patience often separates profitable traders from losing traders.
5. Ignoring Risk Management
Even the strongest Price Action setup can fail.
This is why every trade should include:
- A Stop Loss
- A Take Profit
- Proper position sizing
- A favorable Risk-to-Reward Ratio
Protecting your trading capital is more important than winning every trade.
Best Timeframes for Price Action Trading
Price Action Trading works on virtually every timeframe. However, some timeframes produce more reliable trading signals than others. Once you understand Price Action, the next step is learning how to manage your trade size effectively. Our guide on Top 10 Ways to Calculate Position Size in Forex Trading explains how to protect your account while maximizing opportunities.
5-Minute Chart
Suitable for:
- Scalping
- Very short-term trading
Advantages:
- Many trading opportunities.
Disadvantages:
- High market noise.
- More false signals.
15-Minute Chart
Suitable for:
- Day trading.
- Beginner practice.
Advantages:
- Balanced between speed and reliability.
Disadvantages:
- Requires regular monitoring.
1-Hour Chart
One of the most popular timeframes.
Advantages:
- Clearer market structure.
- Reliable candlestick patterns.
- Less market noise.
Suitable for:
- Swing traders.
- Beginner traders.
4-Hour Chart
Many professional traders prefer the 4-hour timeframe.
Advantages:
- Strong trend identification.
- Reliable support and resistance.
- High-quality Price Action setups.
Ideal for traders who cannot watch charts throughout the day.
Daily Chart
The Daily timeframe provides some of the strongest Price Action signals.
Advantages:
- Very reliable market structure.
- Less emotional trading.
- Fewer false breakouts.
Disadvantages:
- Fewer trading opportunities.
For beginners, the 4-hour and Daily charts are often the best places to start because they produce cleaner market movements and reduce emotional decision-making.
Tips for Beginners Learning Price Action Trading
Learning Price Action takes time and practice. The following tips can help you build confidence and improve your trading skills.
Keep Your Charts Simple
Avoid filling your charts with too many indicators.
Price Action Trading focuses on:
- Candlesticks
- Support
- Resistance
- Trendlines
- Market structure
A clean chart often makes it easier to identify trading opportunities.
Practice on a Demo Account
Before risking real money, practice identifying Price Action setups on a demo account.
This allows you to build confidence without exposing your trading capital to unnecessary risk.
Be Patient
Successful traders understand that waiting is part of trading.
Not every candle creates a trading opportunity.
High-quality setups usually provide better long-term results than frequent trading.
Keep a Trading Journal
Record every trade.
Include:
- Entry reason.
- Stop Loss.
- Take Profit.
- Market conditions.
- Result.
- Lessons learned.
Reviewing your trades regularly helps identify strengths and weaknesses.
Focus on Consistency
Many beginners become obsessed with making quick profits.
Instead, focus on:
- Following your trading plan.
- Managing risk.
- Learning from mistakes.
- Improving gradually.
Consistency leads to long-term success.
Frequently Asked Questions (FAQs)
Is Price Action Trading Good for Beginners?
Yes. Price Action Trading is one of the best approaches for beginners because it teaches traders to understand the market itself rather than relying entirely on indicators.
Can I Trade Without Indicators?
Yes.
Many professional traders rely primarily on Price Action.
However, some traders combine Price Action with one or two indicators for additional confirmation.
Which Timeframe Is Best?
The 4-hour and Daily charts are generally recommended for beginners because they provide clearer trends and fewer false signals.
Does Price Action Work in All Markets?
Yes.
Price Action principles can be applied to:
- Forex
- Stocks
- Commodities
- Cryptocurrencies
- Indices
Because every financial market is driven by buyers and sellers.
How Long Does It Take to Learn Price Action?
Learning the basics may take only a few weeks.
However, becoming consistently profitable usually requires months of practice, experience, and disciplined risk management.
Final Thoughts
Price Action Trading is more than just recognizing candlestick patterns; it is about understanding how the market behaves. Every price movement tells a story about the ongoing battle between buyers and sellers. By learning to read this story through market structure, support and resistance, trend analysis, and candlestick formations, traders can make more informed decisions without relying heavily on technical indicators. Becoming a successful Price Action trader requires continuous learning. We recommend exploring our beginner guides on technical analysis, candlestick patterns, support and resistance, trend trading, risk management, and position sizing to build a complete understanding of the Forex market.
Remember that no trading strategy guarantees success. The goal of Price Action Trading is not to predict every market movement perfectly but to identify high-probability opportunities while managing risk effectively.
As you continue your Forex journey, focus on practicing regularly, keeping your charts simple, following your trading plan, and protecting your capital. Over time, these habits will help you become a more disciplined and confident trader.
Risk Disclaimer
Disclaimer: This article is provided for educational purposes only and should not be considered financial or investment advice. Forex trading involves significant risk and may not be suitable for all investors. Past performance does not guarantee future results. Always conduct your own research, practice on a demo account, and consult a qualified financial advisor before making investment decisions. Before trading with real money, make sure you understand the risks involved. The U.S. Commodity Futures Trading Commission (CFTC) provides educational resources to help traders understand leveraged markets and make informed financial decisions.
Continue Your Forex Learning Journey
If you found this guide helpful, continue expanding your Forex knowledge with these beginner-friendly articles on BuildSmartAfri:
- What Is Technical Analysis? A Beginner’s Guide to Reading Forex Charts
- Support and Resistance in Forex Trading for Beginners
- Top 11 Candlestick Patterns Every Forex Trader Should Know
- Trend Trading for Beginners: How to Follow Market Direction
- How to Set Stop Loss and Take Profit Correctly in Forex
- Top 10 Ways to Calculate Position Size in Forex Trading
- How to Use an Economic Calendar in Forex Trading
Each guide builds on the previous one, helping you develop a strong foundation in Forex trading.