
Introduction:
Support and Resistance in Forex Trading for Beginners: A Complete Step-by-Step Guide. If you’ve ever looked at a Forex chart and wondered why the price suddenly stops falling and starts moving upward, or why it repeatedly struggles to move higher before reversing, you’ve already encountered one of the most powerful concepts in technical analysis: support and resistance. Support and resistance are core concepts in technical analysis, helping traders’ study historical price movements to make informed trading decisions. If you’re new to the currency market, begin with our What Is Forex Trading? A Beginner’s Guide to understand the fundamentals before learning technical analysis.
Support and resistance levels are the foundation of many successful trading strategies. Professional traders use them to identify potential entry points, set stop-loss orders, determine profit targets, and understand where the market is likely to react. Whether you’re a day trader, swing trader, or long-term investor, learning how to identify these levels can significantly improve your trading decisions.
Many beginner traders make the mistake of entering trades randomly without paying attention to key price levels. As a result, they often buy just before the market reverses downward or sell moments before the price begins to rise. Understanding support and resistance helps you avoid these common mistakes by giving you a clearer picture of where buyers and sellers are likely to become active.
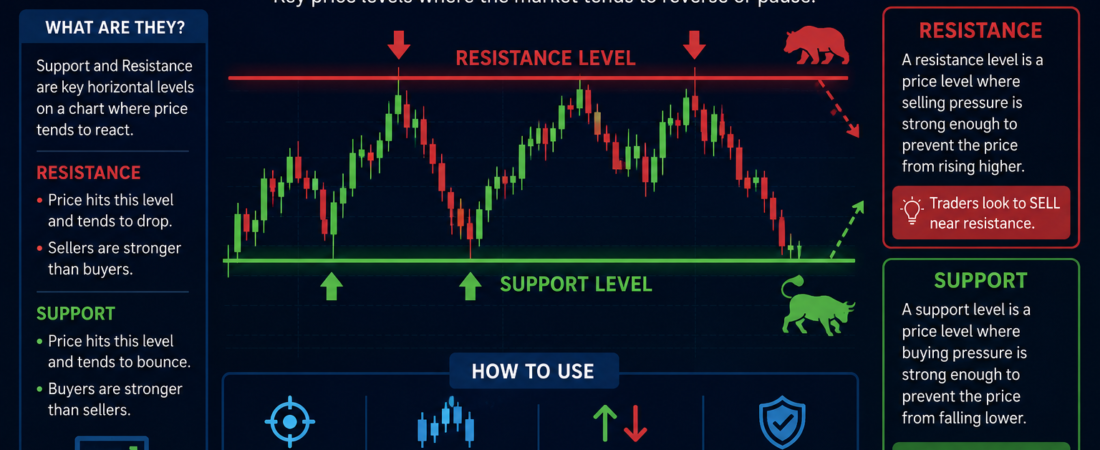
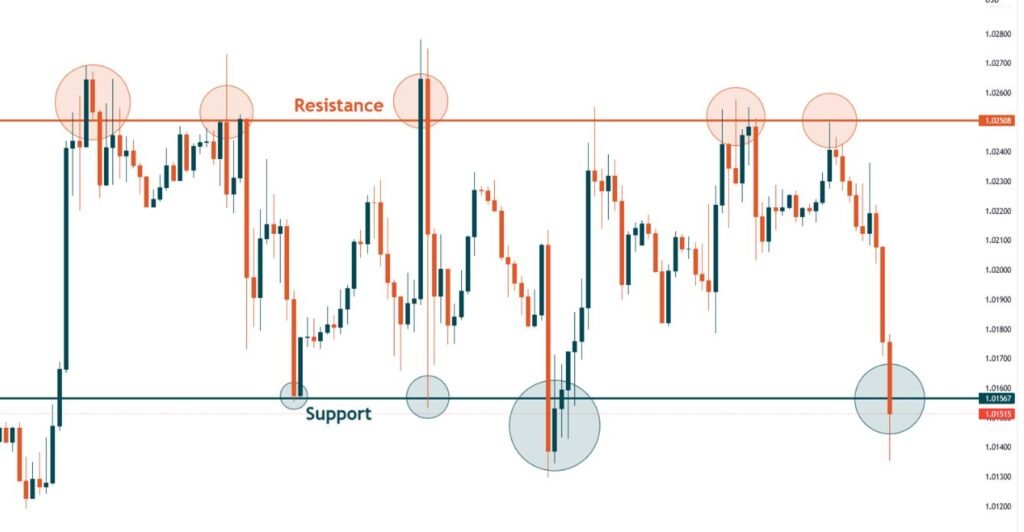
Think of support and resistance as invisible barriers on a price chart. A support level acts like a floor, where buying pressure may become strong enough to stop prices from falling further. A resistance level acts like a ceiling, where selling pressure may prevent prices from moving higher.
Although these levels are not always perfect, they provide valuable clues about market psychology. The more often price reacts to a support or resistance level, the more significant that level becomes.
In this comprehensive guide, you’ll learn:
- What support and resistance mean in Forex trading.
- Why these levels are important.
- How to identify support and resistance on any chart.
- Different types of support and resistance.
- Practical examples using real trading scenarios.
- Common mistakes beginners should avoid.
- Tips for using support and resistance together with other trading tools.
By the end of this article, you’ll be able to identify important price levels with confidence and use them to improve your trading decisions while managing risk more effectively.
What Are Support and Resistance in Forex Trading?
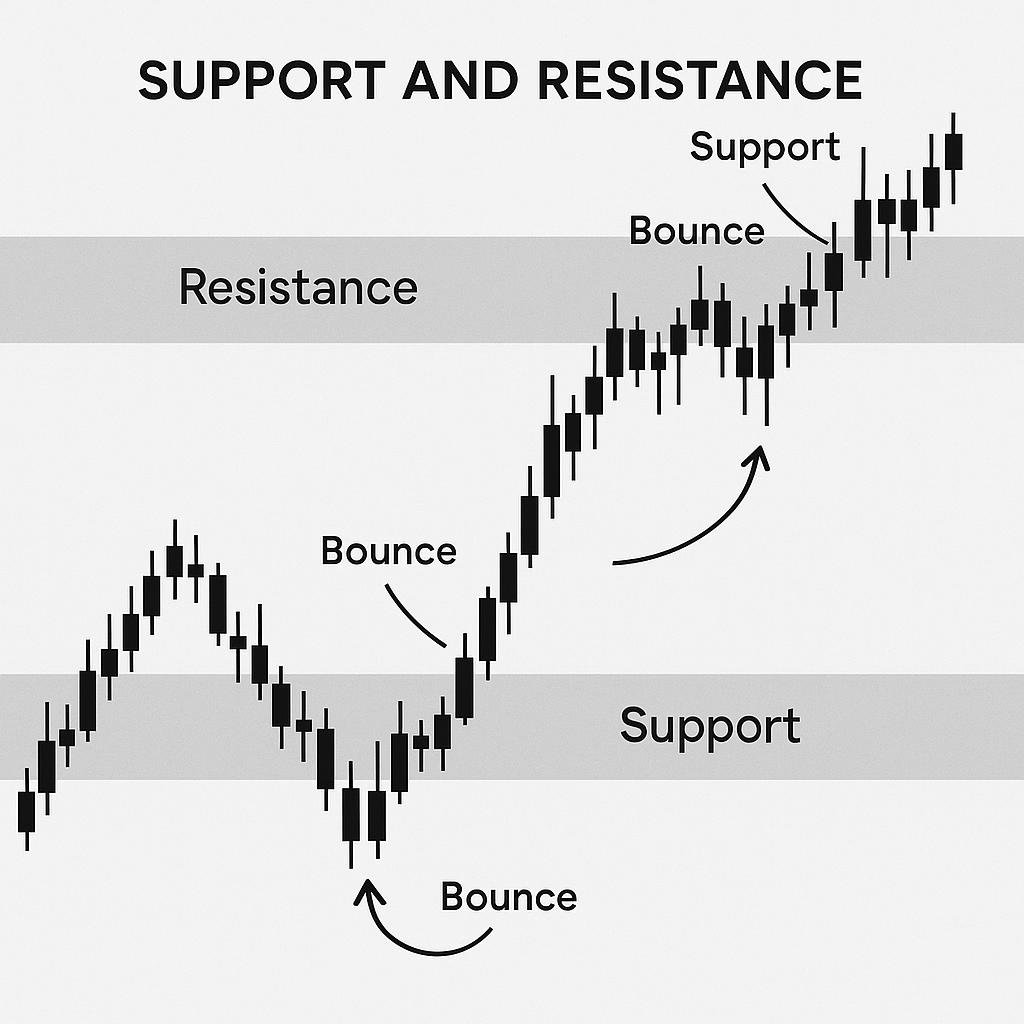
Support and resistance are price levels where the market has historically struggled to continue moving in one direction.
These levels exist because of the constant battle between buyers and sellers. Understanding support and resistance is one of the most important skills in technical analysis because these levels help traders identify potential market turning points.
When buyers become stronger than sellers, prices tend to rise.
When sellers become stronger than buyers, prices tend to fall.
Support and resistance represent areas where this balance often changes.
What Is Support?
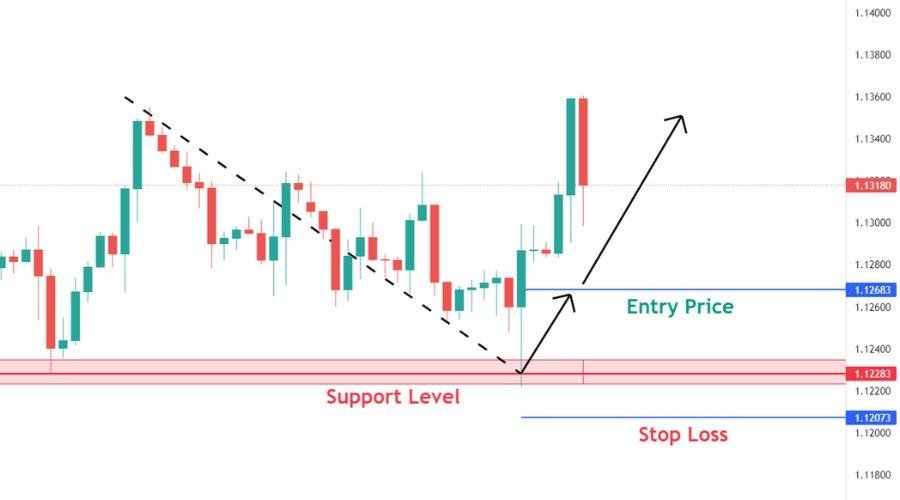
Support is a price level where a downtrend may pause or reverse because buying pressure becomes stronger than selling pressure.
Imagine dropping a rubber ball onto the floor.
Each time it hits the floor, it bounces back upward.
In Forex trading, support works in a similar way.
As price falls toward a support level, buyers begin entering the market because they believe the currency pair is becoming undervalued.
This increased buying demand can stop the decline and push prices back upward.
For example:
Suppose the EUR/USD currency pair has fallen to 1.1000 several times over the past month.
Each time the price reaches 1.1000, buyers step in and the market begins rising again.
This repeated reaction suggests that 1.1000 is acting as a strong support level.
However, it’s important to remember that support is not an unbreakable wall.
If selling pressure becomes stronger than buying pressure, the support level can eventually break, allowing the price to continue falling.
What Is Resistance?
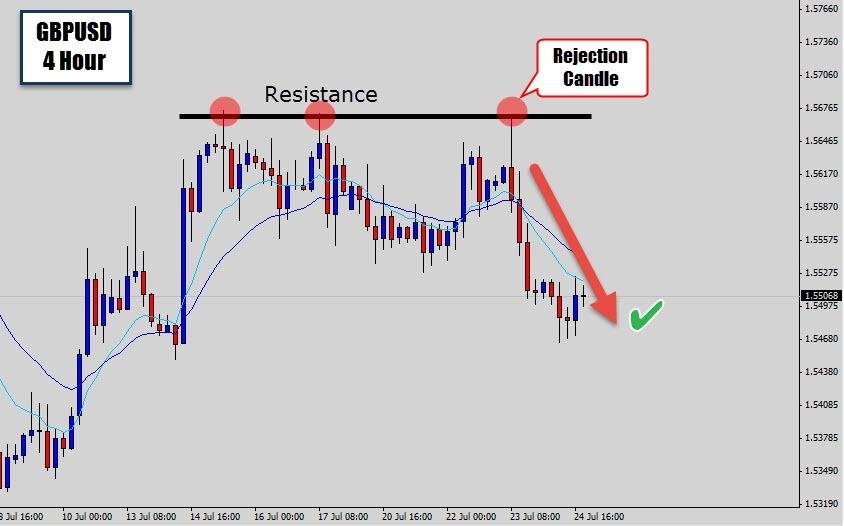
Resistance is the opposite of support.
It is a price level where an uptrend may slow down or reverse because selling pressure becomes stronger than buying pressure.
Think of resistance as a ceiling.
Each time the market rises toward this ceiling, sellers become more active and push prices back downward.
For example:
Assume GBP/USD repeatedly rises to 1.3200 but struggles to move any higher.
Every time the price approaches 1.3200, more traders begin selling, causing the market to reverse.
In this situation, 1.3200 becomes a resistance level.
Just like support, resistance is not permanent.
If buyers become strong enough to overcome selling pressure, the resistance level may break, allowing the market to continue its upward trend.
Why Do Support and Resistance Levels Form?
Support and resistance levels are created by market psychology.
Thousands of traders around the world monitor similar price levels.
Many institutional investors, banks, hedge funds, and retail traders place buy or sell orders around these areas.
As a result, these price levels attract significant trading activity.
Some common reasons these levels develop include:
- Traders taking profits.
- Buyers entering after a price decline.
- Sellers entering after a price rally.
- Previous market reactions creating psychological price zones.
- Large institutional orders influencing supply and demand.
The more times price reacts to a particular level, the more attention traders give it.
This is why support and resistance often become self-reinforcing—they work because many traders expect them to work.
Support and Resistance Are Zones, Not Exact Prices
One mistake beginners frequently make is treating support and resistance as exact lines.
In reality, they are better viewed as zones rather than single prices.
For example, instead of expecting support to occur exactly at 1.1000, the market may react anywhere between 1.0995 and 1.1005.
This flexibility helps explain why price sometimes briefly moves beyond a level before reversing.
Successful traders focus on identifying these broader areas instead of expecting perfect precision.
In the next section, we’ll explore why support and resistance are so important, how professional traders use them to plan trades, and why they form the backbone of many successful Forex trading strategies.
Why Support and Resistance Are Important in Forex Trading
Support and resistance are much more than simple lines on a chart; they are decision-making tools that help traders understand where the market is likely to react. Support and resistance work even better when combined with trend analysis. Learn how to identify market direction in our Trend Trading for Beginners guide.
Professional Forex traders rarely enter trades without first identifying important support and resistance levels. These price zones help them determine where to buy, where to sell, where to place stop-loss orders, and where to take profits. Many traders place Stop-Loss Orders just below support or above resistance to reduce potential losses while giving the trade room to develop.
For beginners, learning to recognize these levels can dramatically improve trading confidence and reduce unnecessary losses.
Let’s explore the key reasons why support and resistance are so important.
1. They Help You Find High-Probability Entry Points
One of the biggest challenges beginners face is knowing when to enter a trade.
Many traders buy after prices have already risen significantly or sell after the market has already fallen sharply. This often leads to entering trades just before a reversal.
Support and resistance help solve this problem.
Buying Near Support
When price approaches a strong support level, buyers often become more active.
Instead of buying randomly in the middle of a trend, traders wait for price to reach support before looking for confirmation that the market is ready to move higher.
For example:
EUR/USD has been falling throughout the day.
The price reaches a support level around 1.1050, where it has bounced several times before.
You notice bullish candlestick patterns forming near this area.
Rather than entering the trade earlier, you wait for this confirmation before buying.
This gives you a better entry price and reduces unnecessary risk.
Selling Near Resistance
The opposite applies when selling.
Suppose GBP/USD has been rising toward 1.3200, a resistance level that has rejected price several times in the past.
Instead of chasing the market higher, traders wait for price to approach resistance and then watch for signs that sellers are taking control.
Entering near resistance often provides a more favorable selling opportunity.
2. They Help You Place Better Stop-Loss Orders
A stop-loss protects your trading account by limiting potential losses.
However, many beginners place stop-loss orders too close to the current market price.
Small market fluctuations trigger their stop-loss before the trade has time to develop.
Support and resistance help traders place stop-loss orders more strategically.
For example:
If you buy at a support level, your stop-loss is usually placed slightly below the support zone.
This gives the market enough room to fluctuate while still protecting your account if support fails.
Likewise, when selling near resistance, traders often place their stop-loss just above the resistance level.
This approach reduces the chances of being stopped out by normal market noise.
3. They Help You Set Realistic Take-Profit Targets
Knowing where to exit a profitable trade is just as important as knowing where to enter.
Support and resistance provide logical areas for taking profits.
For example:
You buy EUR/USD near support.
Instead of guessing where price might stop, you identify the next resistance level.
That resistance becomes your initial profit target.
Similarly, if you’re selling from resistance, the next support level often becomes a reasonable area to take profits.
Using support and resistance for profit targets creates a structured trading plan instead of relying on emotions.
4. They Help You Understand Market Psychology
Every price movement is driven by buyers and sellers.
Support and resistance reveal where these two groups are most active.
Imagine a popular product that goes on sale.
Many people rush to buy because they believe it’s a good value.
The same principle applies in Forex.
When prices fall to support, many traders see an opportunity to buy.
When prices rise to resistance, many traders believe the market is becoming expensive and begin selling.
Understanding this psychology helps traders anticipate potential market reactions instead of reacting emotionally.
5. They Improve Risk Management
Support and resistance work hand in hand with proper risk management.
Suppose your trading strategy only allows a maximum risk of 1% per trade.
By entering near support or resistance, you can often place tighter stop-loss orders.
Smaller stop-loss distances allow you to maintain proper position sizing while keeping your overall risk under control.
This is why many professional traders combine support and resistance with sound money management techniques.
6. They Work Across All Timeframes
One of the greatest advantages of support and resistance is their flexibility.
Whether you’re trading:
- 5-minute charts
- 15-minute charts
- 1-hour charts
- 4-hour charts
- Daily charts
- Weekly charts
Support and resistance remain relevant.
However, levels identified on higher timeframes generally carry more importance because they represent stronger market participation.
For beginners, it’s often recommended to start analyzing the 4-hour and daily charts, where support and resistance levels are usually clearer and less affected by market noise.
7. They Help Confirm Trading Strategies
Support and resistance become even more powerful when combined with other forms of technical analysis.
For example, a trader may look for:
- A bullish candlestick pattern forming at support.
- A bearish engulfing candle near resistance.
- A moving average crossing at a key support level.
- A trendline intersecting with resistance.
- An RSI indicator showing oversold conditions near support.
When multiple signals point to the same area, the probability of a successful trade often increases.
Rather than relying on one indicator alone, professional traders seek confirmation from several sources.
Practical Scenario
Imagine you’re watching the USD/JPY currency pair.
You notice that the price has bounced from 145.00 three different times over the past two weeks.
Each time the market touches this level, buyers quickly push the price higher. Combining support and resistance with the Relative Strength Index (RSI) can help traders identify overbought and oversold market conditions.
This tells you that 145.00 is acting as strong support.
A few days later, the market falls back toward 145.00 again.
Instead of buying immediately, you wait for confirmation.
A bullish hammer candlestick forms at the support zone.
You enter the trade.
Your stop-loss is placed just below the support level, and your take-profit is set near the next resistance level.
By following this process, you’ve based your trade on logic, market structure, and risk management—not emotion.
Key Takeaway
Support and resistance are among the most valuable tools in technical analysis because they help traders:
- Identify high-probability buying and selling opportunities.
- Place smarter stop-loss orders.
- Set realistic profit targets.
- Understand market psychology.
- Improve risk management.
- Confirm trading strategies.
- Trade with greater confidence and discipline.
Mastering these concepts won’t guarantee winning trades every time, but they will help you make more informed trading decisions and avoid many of the common mistakes beginners make.
In the next section, you’ll learn how to identify support and resistance levels on a Forex chart, using simple techniques that you can apply immediately on platforms like MetaTrader and TradingView.
How to Identify Support and Resistance Levels on a Forex Chart
Now that you understand what support and resistance are and why they are important, the next step is learning how to identify them correctly. Learning to read candlestick charts can help you confirm whether price is likely to bounce from a support or resistance zone.
Many beginners think they need advanced software or complicated indicators to find support and resistance levels. The truth is, the most reliable support and resistance levels can often be identified using nothing more than the price chart itself. You can practice drawing support and resistance levels using free charting platforms like TradingView, which offers powerful chart analysis tools. Before drawing support and resistance levels, it’s important to understand how to analyze price movement. Our How to Read Forex Charts guide explains the basics of chart reading and candlestick analysis.
Professional traders spend more time studying price action than relying on indicators because price tells the real story of the market. A good Forex broker should provide advanced charting tools that make it easier to identify support and resistance levels. Learn what to look for in How to Choose the Best Forex Broker for Beginners.
Let’s look at the step-by-step process.
Step 1: Open a Clean Price Chart
The first step is to remove unnecessary indicators from your chart.
If your chart is filled with moving averages, oscillators, and multiple indicators, it becomes difficult to clearly identify important price levels.
Start with a clean candlestick chart.
Popular platforms include:
- MetaTrader 4 (MT4)
- MetaTrader 5 (MT5)
- TradingView
- cTrader
A clean chart allows you to focus entirely on price movement.
Step 2: Choose a Higher Timeframe First
One of the biggest mistakes beginners make is trying to identify support and resistance on very small timeframes like the 1-minute or 5-minute chart.
These lower timeframes contain a lot of market noise and false signals.
Instead, begin with:
- Daily Chart (D1)
- 4-Hour Chart (H4)
- 1-Hour Chart (H1)
Higher timeframes usually show stronger and more reliable support and resistance levels because they reflect the decisions of larger market participants, including banks and institutional traders.
After identifying major levels on higher timeframes, you can move to lower timeframes to refine your trade entries.
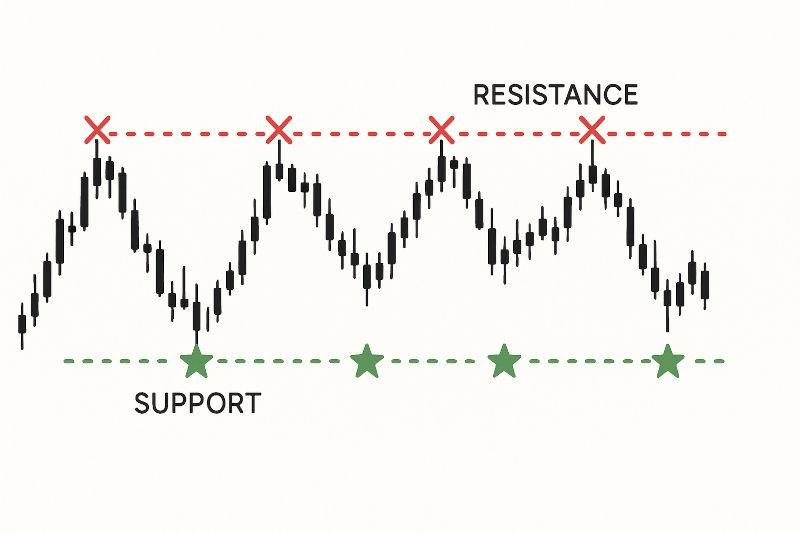
Step 3: Look for Repeated Price Reactions
Support and resistance levels are created when price reacts to the same area multiple times.
Ask yourself:
- Where has price repeatedly bounced upward?
- Where has price repeatedly reversed downward?
If the market has respected a price level several times, it is likely to remain important.
For example:
EUR/USD falls to 1.0900 three separate times over several weeks.
Each time, buyers enter the market and push prices higher.
This repeated reaction tells you that 1.0900 is acting as a support zone.
Likewise:
GBP/USD rises to 1.3200 four different times but fails to break above it.
This repeated rejection identifies 1.3200 as a strong resistance level.
The more times a level is respected without breaking, the more significant it becomes.
Step 4: Draw Horizontal Support and Resistance Zones
After identifying repeated reactions, draw horizontal lines or, even better, zones across those price areas.
Remember:
Support and resistance are rarely exact prices.
Instead of drawing a very thin line, think of them as areas where buying or selling pressure increases.
For example:
Instead of marking support exactly at 1.1000, consider a support zone between:
1.0995 and 1.1005
This approach better reflects how the market behaves.
Most professional traders draw zones rather than expecting price to reverse at an exact pip.
Step 5: Observe How Price Behaves Around the Level
Simply reaching support or resistance does not automatically mean the market will reverse.
Wait for confirmation.
Some common confirmation signals include:
Bullish Confirmation Near Support
- Hammer candlestick
- Bullish engulfing pattern
- Morning star pattern
- Strong bullish candle
These patterns suggest buyers are gaining control.
Bearish Confirmation Near Resistance
- Shooting star
- Bearish engulfing candle
- Evening star pattern
- Strong bearish rejection candle
These indicate sellers may be taking control.
Waiting for confirmation reduces the chances of entering trades too early.
Step 6: Watch for Breakouts
Support and resistance do not last forever.
Eventually, one side becomes stronger.
If buyers overwhelm sellers, resistance breaks.
If sellers overpower buyers, support breaks.
A genuine breakout usually includes:
- A strong candle closing beyond the level.
- Increased trading activity.
- Follow-through in the breakout direction.
For example:
EUR/USD has struggled below 1.1200 for weeks.
Finally, a large bullish candle closes above 1.1200.
This suggests resistance has been broken and may now become a new support level.
This phenomenon is known as role reversal.
Step 7: Understand Role Reversal
One of the most fascinating characteristics of support and resistance is that they often switch roles.
When resistance is broken, it frequently becomes new support.
When support is broken, it often becomes new resistance.
For example:
Resistance:
1.2500
Price breaks above this level.
A few days later, the market retraces back to 1.2500.
Instead of falling lower, buyers enter again and push prices upward.
The old resistance has now become support.
Recognizing this role reversal helps traders identify new trading opportunities.
Practical Example
Imagine you’re analyzing the EUR/USD daily chart. After identifying a support or resistance level, calculate the correct lot size before entering a trade. Read our guide on How to Calculate Position Size in Forex Trading to protect your trading capital.
You notice:
- Price bounced from 1.0850 three times over the past month.
- Price failed to rise above 1.1050 on four separate occasions.
You draw:
Support Zone:
1.0845–1.0855
Resistance Zone:
1.1045–1.1055
A week later, price falls toward the support zone.
Instead of buying immediately, you wait.
A bullish engulfing candle forms.
The next candle closes higher.
This confirmation gives you more confidence to enter a buy trade.
Your stop-loss is placed slightly below the support zone, while your take-profit is set near the resistance zone.
This structured approach removes guesswork and helps you trade based on market evidence rather than emotions.
Common Beginner Mistakes When Drawing Support and Resistance
Many traders struggle with support and resistance because they make a few simple mistakes.
Avoid these common errors:
- Drawing too many support and resistance levels.
- Treating levels as exact prices instead of zones.
- Ignoring higher timeframe levels.
- Entering trades without waiting for confirmation.
- Assuming every support or resistance level will hold forever.
- Redrawing levels after every small market movement.
The goal is not to fill your chart with lines.
The goal is to identify only the most significant levels where price has shown strong historical reactions.
Key Takeaway
Identifying support and resistance becomes much easier with practice.
Remember these simple steps:
- Start with a clean chart.
- Analyze higher timeframes first.
- Look for repeated price reactions.
- Draw zones instead of exact lines.
- Wait for confirmation before entering trades.
- Watch for breakouts and role reversals.
As you continue studying charts, you’ll begin to notice that support and resistance appear naturally across almost every currency pair and timeframe.
In the next section, we’ll explore the different types of support and resistance, including horizontal levels, trendlines, moving averages, psychological price levels, and Fibonacci retracement levels, and explain how professional traders combine them to improve trading accuracy.
Frequently Asked Questions (FAQ)
1. What is support in Forex trading?
Support is a price level where a currency pair tends to stop falling because buying pressure becomes stronger than selling pressure. It acts like a floor, preventing prices from moving lower until sellers gain enough strength to break through.
2. What is resistance in Forex trading?
Resistance is a price level where a currency pair often stops rising because selling pressure becomes stronger than buying pressure. It acts like a ceiling, making it difficult for prices to continue moving upward.
3. How do beginners identify support and resistance?
The easiest way is to look for areas where price has repeatedly reversed in the past.
If the market has bounced upward several times from the same area, it is likely a support zone.
If the market has repeatedly fallen after reaching a certain price, it is likely a resistance zone.
Always start your analysis on higher timeframes like the 4-hour or daily chart because these levels are generally more reliable.
4. Are support and resistance always accurate?
No.
Support and resistance are probability-based trading tools, not guarantees.
Sometimes price will respect these levels and reverse.
Other times, strong buying or selling pressure will cause the market to break through them.
This is why experienced traders always wait for confirmation before entering a trade.
5. Which timeframe is best for drawing support and resistance?
Support and resistance can be identified on every timeframe, but higher timeframes usually produce stronger levels.
For beginners, the recommended order is:
- Daily Chart
- 4-Hour Chart
- 1-Hour Chart
Once major levels are identified, you can move to lower timeframes for more precise trade entries.
6. Can support become resistance?
Yes.
One of the most important concepts in technical analysis is role reversal.
When a support level is broken, it often becomes a new resistance level.
Similarly, when resistance is broken, it frequently becomes new support.
Recognizing this transition can help traders identify high-probability trading opportunities.
7. Should I use indicators together with support and resistance?
Yes.
Support and resistance become even more effective when combined with other technical analysis tools, such as:
- Candlestick patterns
- Trendlines
- Moving averages
- RSI (Relative Strength Index)
- MACD
- Fibonacci Retracement
Using multiple confirmations can improve your confidence before entering a trade.
8. Can support and resistance be used for all trading strategies?
Absolutely.
Whether you’re a:
- Scalper
- Day Trader
- Swing Trader
- Position Trader
Support and resistance remain valuable because every market moves according to supply and demand.
The only difference is the timeframe used for analysis.
Final Thoughts
Support and resistance are among the most powerful concepts every Forex trader should master. While they may seem simple at first, they provide valuable insight into how buyers and sellers interact in the market. Even the strongest support and resistance levels can break during major economic announcements. Learn how to prepare for high-impact events in How to Use an Economic Calendar in Forex Trading.
Instead of entering trades randomly, support and resistance help you identify logical entry points, place smarter stop-loss orders, set realistic profit targets, and better understand market psychology. These skills can significantly improve your decision-making and help you trade with greater confidence. Practice drawing support and resistance levels in a demo account before trading with real money. Our Demo Trading vs Live Trading guide explains why this is an essential step for beginners.
However, it’s important to remember that no support or resistance level is guaranteed to hold. The Forex market is constantly changing, and strong economic news, institutional trading activity, or shifts in market sentiment can cause price to break through even the strongest levels.
For this reason, never rely on support and resistance alone.
Always wait for confirmation from price action, combine these levels with sound risk management, and avoid risking more than a small percentage of your trading account on any single trade.
Like every trading skill, identifying support and resistance takes practice. Spend time analyzing historical charts, mark important levels, and observe how price reacts around them. The more charts you study, the easier it becomes to recognize these key areas naturally.
Remember, successful Forex trading isn’t about predicting every market move. It’s about making informed decisions based on probability, discipline, and proper risk management.
Master support and resistance, combine them with a solid trading plan, and you’ll have one of the strongest foundations for long-term success in the Forex market.
Continue Your Forex Learning Journey
Expand your trading knowledge with these beginner-friendly guides on BuildSmartAfri:
- What Is Forex Trading? A Beginner’s Guide
- Trend Trading for Beginners: How to Follow Market Direction
- How to Calculate Position Size in Forex Trading
- How to Use an Economic Calendar in Forex Trading
- How to Open Your First Forex Trading Account
- Demo Trading vs Live Trading: Which Should Beginners Start With?
- How Stop-Loss Orders Help Limit Investment Losses and Risk
Reading these guides will help you build a complete understanding of technical analysis, risk management, and trading psychology, three essential pillars of successful Forex trading.
Disclaimer
The information provided in this article is for educational and informational purposes only and should not be considered financial, investment, or trading advice.
Forex trading involves significant risk and may not be suitable for all investors. Currency prices can fluctuate rapidly, and you may lose part or all of your invested capital. Past performance is not a reliable indicator of future results.
Before trading with real money, practice your skills on a demo account, develop a well-defined trading plan, and use appropriate risk management techniques. Never trade with money you cannot afford to lose, and consider seeking advice from a qualified financial professional if needed.