
A Complete Beginner’s Guide to Reading Price Action Like a Professional
Introduction:
Top 11 Candlestick Patterns Every Forex Trader Should KnowCandlestick patterns are one of the most powerful tools used by Forex traders to understand market behavior and make informed trading decisions. Whether you are a complete beginner or an experienced trader, learning how to read candlestick patterns can significantly improve your ability to identify potential buying and selling opportunities.
Every movement in the Forex market represents a battle between buyers and sellers. Candlesticks capture this battle visually, showing who was in control during a specific period and providing clues about what may happen next. Instead of relying on guesswork, traders use candlestick patterns to interpret market psychology, confirm trend direction, and identify possible reversals or continuation signals.
Originally developed by Japanese rice trader Munehisa Homma in the 18th century, candlestick charting has become one of the most widely used methods of technical analysis in financial markets. Today, traders across the world use candlestick patterns when analyzing Forex pairs, stocks, commodities, cryptocurrencies, and indices.
However, while candlestick patterns are incredibly useful, they should never be used in isolation. The most successful traders combine candlestick analysis with trend identification, support and resistance levels, risk management, and other technical tools to increase the probability of successful trades. To maximize your trading success, it’s important to understand the broader concepts of technical analysis. If you’re new to chart analysis, start with our guide on What Is Technical Analysis? A Beginner’s Guide to Reading Forex Charts before diving deeper into candlestick patterns.
In this comprehensive guide, you’ll discover the 15 most important candlestick patterns every Forex trader should know, understand what each pattern reveals about market sentiment, learn when to trust these signals, and avoid common mistakes that often lead to unnecessary losses.
Why Every Forex Trader Should Learn Candlestick Patterns
Many beginner traders focus heavily on indicators while overlooking one of the most valuable sources of market information: price action. Candlestick patterns allow traders to interpret price movement directly without waiting for lagging indicators to generate signals. For a deeper understanding of Japanese candlestick charts and how they are used in technical analysis, you can also explore this detailed explanation from Investopedia. Candlestick patterns become even more reliable when they align with important support and resistance levels. Learn how to identify these critical price zones in our complete guide on Support and Resistance in Forex Trading for Beginners.
Learning candlestick patterns offers several important advantages:
- They help identify potential market reversals before they become obvious.
- They provide confirmation for trend continuation.
- They improve entry and exit timing.
- They strengthen confidence when combined with support and resistance.
- They help traders understand buyer and seller psychology.
- They can be applied across different timeframes and currency pairs.
Instead of randomly entering trades, traders who understand candlestick patterns learn to wait patiently for high-probability setups before risking their capital.
What You’ll Learn in This Guide
By the end of this article, you will understand:
- What candlestick patterns are.
- How to read Japanese candlesticks.
- The anatomy of a candlestick.
- The 15 most important candlestick patterns.
- Bullish reversal patterns.
- Bearish reversal patterns.
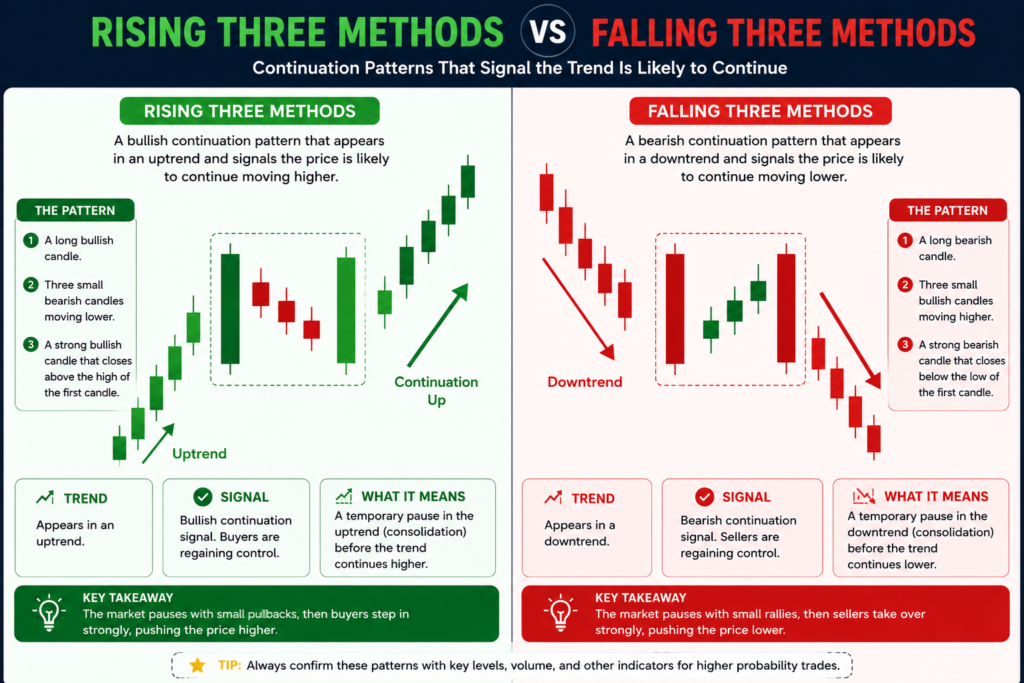
- Continuation patterns.
- How to combine candlestick patterns with support and resistance.
- Common mistakes beginners should avoid.
- Practical examples of using candlestick patterns in Forex trading.
Whether your goal is to trade part-time, build long-term trading skills, or simply understand how professional traders analyze the market, mastering these candlestick patterns will give you a solid foundation for making more informed trading decisions.
Understanding the Anatomy of a Candlestick
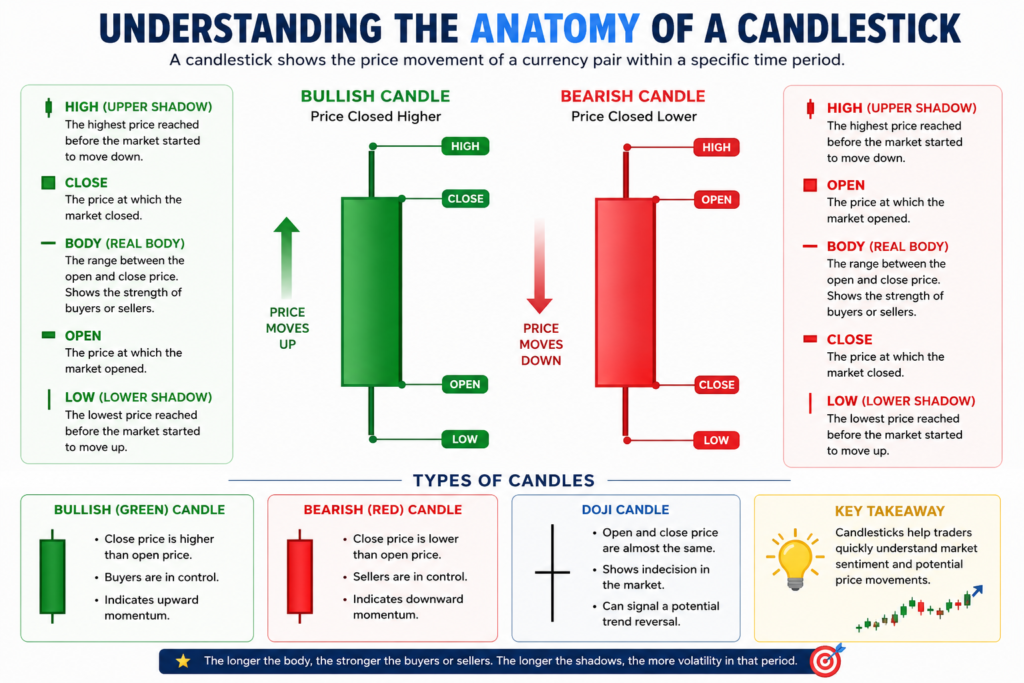
Before learning the different candlestick patterns, it is essential to understand the structure of a single candlestick. Every candlestick represents the price movement of a currency pair during a specific period. Depending on the timeframe you select, a single candlestick can represent one minute, five minutes, one hour, four hours, one day, one week, or even one month of trading activity. If you’re new to Forex trading and would like to learn more about candlestick patterns and other beginner concepts, the comprehensive lessons available on BabyPips provide an excellent starting point.
Each candlestick tells the story of what happened during that period by showing four important prices:
- Opening Price – The price at which the trading period began.
- Closing Price – The price at which the trading period ended.
- Highest Price (High) – The highest price reached during that period.
- Lowest Price (Low) – The lowest price reached during that period.
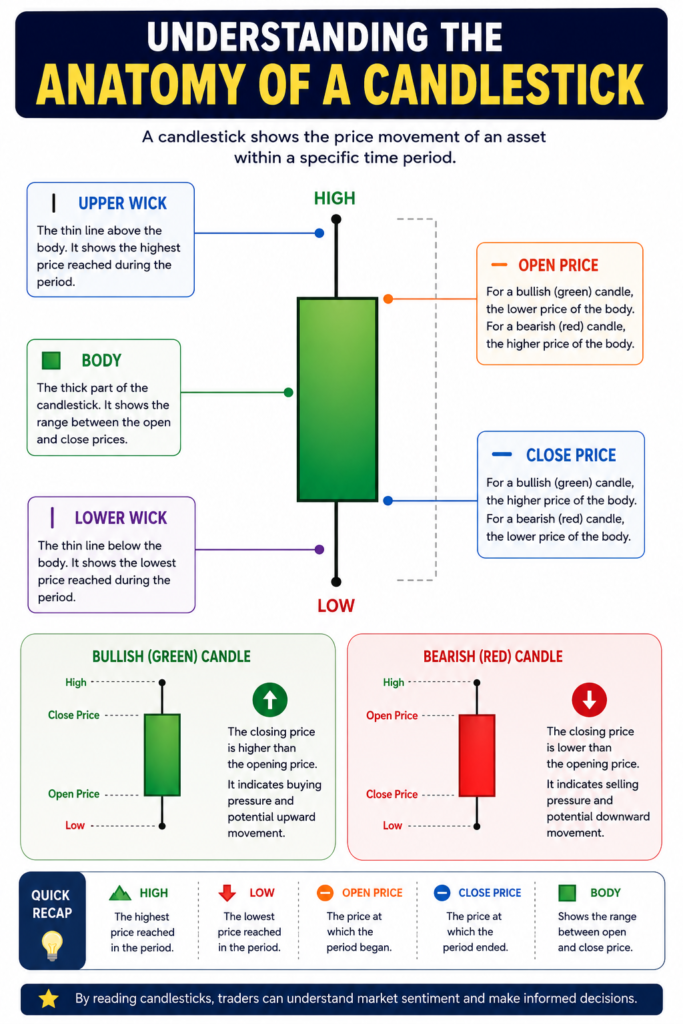
Together, these four prices help traders understand whether buyers or sellers were in control of the market.
The Four Parts of a Candlestick
1. The Body
The body is the thick rectangular part of the candlestick. It shows the difference between the opening price and the closing price.
- A large body indicates strong buying or selling pressure.
- A small body suggests indecision or a balance between buyers and sellers.
For example, if EUR/USD opens at 1.1200 and closes at 1.1250, the body represents the 50-pip movement between those two prices.
Large bodies often appear during strong market trends, while smaller bodies frequently appear when the market is consolidating or preparing for a potential reversal.
2. The Upper Shadow (Upper Wick)
The upper shadow, also called the upper wick, is the thin line extending above the body.
It represents the highest price reached before the market moved back down.
A long upper wick often suggests that buyers pushed prices higher but could not maintain control, allowing sellers to drive the price back down before the candle closed.
This can be an early sign of weakening bullish momentum, especially near a strong resistance level.
3. The Lower Shadow (Lower Wick)
The lower shadow extends below the body.
It shows the lowest price reached during the trading period before buyers pushed the price back upward.
A long lower wick often indicates that sellers initially controlled the market, but buyers entered aggressively and forced prices back up before the candle closed.
This can signal increasing buying interest, particularly near important support levels.
4. The Color of the Candlestick
Most trading platforms use two colors to make candlesticks easy to interpret.
Bullish Candlestick
A bullish candle forms when the closing price is higher than the opening price.
It is usually displayed as:
- Green
- White
- Blue (depending on the trading platform)
Bullish candles indicate that buyers were stronger than sellers during that trading period.
Bearish Candlestick
A bearish candle forms when the closing price is lower than the opening price.
It is usually displayed as:
- Red
- Black
- Orange (depending on the platform)
Bearish candles indicate that sellers controlled the market during that period.
What Does a Candlestick Tell You?
Each candlestick provides valuable information about market sentiment.
For example:
- A large bullish candle shows strong buying pressure and increasing confidence among buyers.
- A large bearish candle indicates strong selling pressure and growing control by sellers.
- A small-bodied candle suggests uncertainty and hesitation in the market.
- A candle with long upper and lower wicks often reflects a battle between buyers and sellers, where neither side gained complete control.
Understanding these clues helps traders make better decisions instead of relying solely on technical indicators.
Practical Example
Imagine the GBP/USD currency pair on the 1-hour chart.
- Opening Price: 1.3500
- Highest Price: 1.3550
- Lowest Price: 1.3480
- Closing Price: 1.3540
Since the closing price is higher than the opening price, the candlestick is bullish.
The candle tells us that:
- Buyers dominated most of the trading session.
- Sellers managed to push the price down briefly to 1.3480, creating a lower wick.
- Buyers regained control and closed the session near the highest price.
- This suggests strong bullish momentum and increasing buying interest.
If this bullish candlestick appears at a key support level and aligns with the overall trend, it may provide a stronger buying signal than if it appeared randomly in the middle of a sideways market.
Key Takeaways
Before memorizing candlestick patterns, focus on understanding what each candlestick is communicating. Every candle represents a story of supply and demand, fear and confidence, and the ongoing struggle between buyers and sellers.
Professional traders don’t simply recognize patterns; they interpret the message behind each candlestick within the broader market context. Developing this skill will help you avoid false signals and make more informed trading decisions.
How Candlestick Patterns Work: Understanding Market Psychology
Many beginner traders make the mistake of memorizing candlestick patterns without understanding why they appear. While recognizing patterns is useful, consistently profitable traders focus on the emotions and decisions that create those patterns. Understanding market psychology is only one part of becoming a successful trader. You should also learn how to identify the overall market direction by reading our Trend Trading for Beginners: How to Follow Market Direction guide.
Every candlestick is the result of thousands of traders buying and selling in response to news, economic events, market expectations, and emotions such as fear, greed, confidence, and uncertainty. These emotions influence price movements and ultimately shape the candlestick patterns we see on our charts.
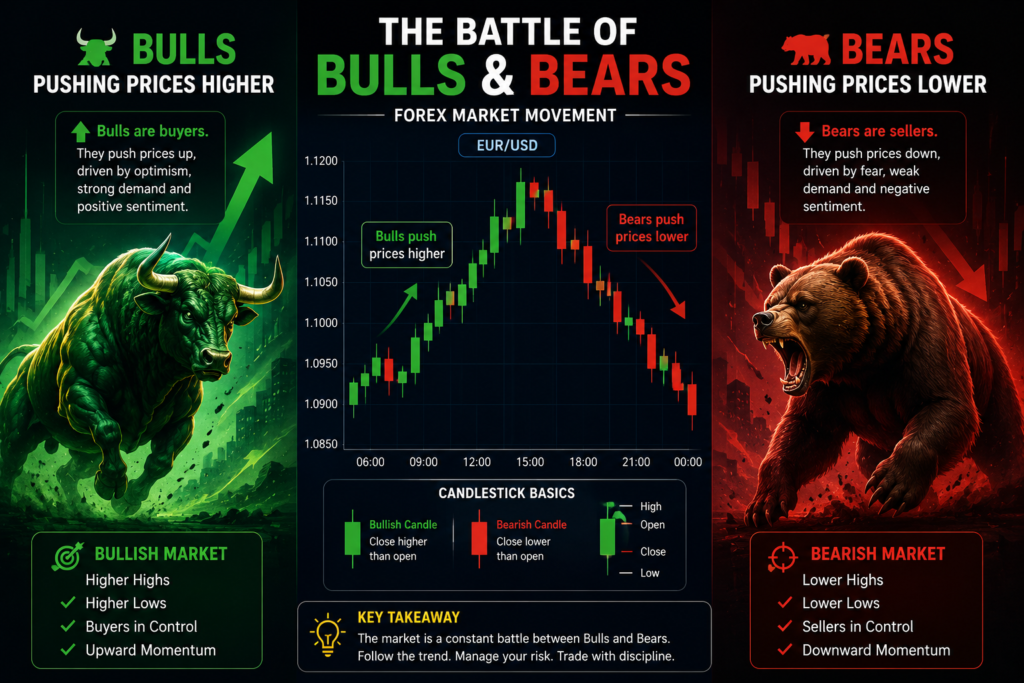
Understanding the psychology behind candlestick patterns helps traders make better decisions because they learn to interpret market behavior instead of simply reacting to chart formations.
The Battle Between Buyers and Sellers
The Forex market is constantly driven by two opposing forces:
- Buyers (Bulls) who believe prices will rise.
- Sellers (Bears) who believe prices will fall.
Every candlestick represents the outcome of this battle during a specific timeframe.
When buyers dominate, prices move higher and bullish candlesticks form.
When sellers dominate, prices move lower and bearish candlesticks appear.
Sometimes neither side gains complete control, leading to small-bodied candles or indecision patterns such as the Doji.
Professional traders study these battles because they reveal who currently controls the market and who is beginning to lose strength.
Why Candlestick Patterns Repeat
One of the key principles of technical analysis is that history tends to repeat itself.
Human emotions remain largely unchanged over time. Traders today still experience fear, greed, hope, and panic just as traders did decades ago.
Because human behavior is consistent, similar buying and selling situations create similar price patterns repeatedly.
For example:
- After a strong downtrend, fear causes many traders to sell at low prices.
- Smart traders begin buying while others panic.
- Buyers gradually regain control.
- A bullish reversal pattern forms.
This process has repeated itself across financial markets for many years, which is why candlestick patterns continue to be valuable tools for traders.
Why Market Context Is More Important Than the Pattern Itself
A common mistake among beginners is believing that every candlestick pattern is a trading signal.
In reality, context is far more important than the pattern itself.
Imagine you see a Hammer candlestick.
If it forms:
- At a major support level
- During an established uptrend
- With strong bullish confirmation
It may indicate a high-probability buying opportunity.
However, if the exact same Hammer appears:
- In the middle of a sideways market
- Without support nearby
- Against a strong downtrend
It may have very little significance.
This is why professional traders never trade candlestick patterns in isolation. They always consider:
- Trend direction
- Support and resistance
- Market structure
- Higher timeframe analysis
- Risk-to-reward ratio
The same candlestick can have very different meanings depending on where it appears on the chart.
The Importance of Confirmation
Successful traders rarely enter a trade immediately after spotting a candlestick pattern.
Instead, they wait for confirmation.
Confirmation simply means allowing the market to prove that the pattern is likely to be valid before risking money.
For example, after spotting a Bullish Engulfing pattern, a trader may wait for:
- The next candle to close higher.
- A breakout above resistance.
- Increasing buying momentum.
- Alignment with the overall trend.
Waiting for confirmation helps reduce false signals and improves the probability of successful trades.
Although it may sometimes mean entering slightly later, it often leads to more consistent results over the long term.
Candlestick Patterns Work Best with Other Technical Tools
Candlestick patterns become much more reliable when combined with other forms of technical analysis.
For example, traders often combine candlestick patterns with:
Support and Resistance
A Hammer forming at a strong support level is generally more reliable than a Hammer appearing in the middle of the chart.
Trend Analysis
Bullish patterns tend to perform better when they appear during an overall uptrend.
Bearish patterns are often more effective when they form during a downtrend.
Moving Averages
Many traders use moving averages to identify the overall market direction before acting on candlestick signals.
Trendlines
Candlestick reversals occurring near trendline support or resistance often provide stronger trading opportunities.
Fibonacci Retracement
Reversal candlestick patterns appearing around key Fibonacci levels can provide additional confirmation for potential entries.
Understanding False Signals
Not every candlestick pattern leads to a profitable trade.
Sometimes markets produce false signals, where a pattern appears convincing but price quickly moves in the opposite direction.
False signals may occur because of:
- Unexpected economic news.
- Low trading volume.
- High market volatility.
- Lack of confirmation.
- Trading against the dominant trend.
This is why professional traders always use stop-loss orders and proper risk management rather than relying solely on chart patterns.
Practical Example
Imagine EUR/USD has been falling steadily for several days before reaching a well-established support level. One of the best ways to master candlestick patterns is through regular practice. You can analyze live Forex charts and identify these patterns yourself using TradingView.
A Hammer candlestick forms, showing that sellers initially pushed prices lower but buyers stepped in aggressively before the candle closed.
Instead of buying immediately, a disciplined trader waits for the next candle.
The following candle closes strongly bullish and breaks above the Hammer’s high.
At the same time:
- The support level remains intact.
- The overall higher-timeframe trend is beginning to turn upward.
- The risk-to-reward ratio is favorable.
This combination provides much stronger evidence than the Hammer candlestick alone, increasing the probability of a successful trade.
Key Takeaways
Candlestick patterns are valuable because they reveal the psychology behind price movements, but they should never be used as standalone trading signals.
The most successful Forex traders combine candlestick analysis with market structure, trend direction, support and resistance, and sound risk management. By focusing on the story each pattern tells rather than simply memorizing its shape, you’ll make more informed trading decisions and avoid many of the mistakes that beginners commonly make.
Top 11 Candlestick Patterns Every Forex Trader Should Know
Candlestick patterns help traders understand whether buyers or sellers are currently controlling the market. Some patterns signal that a trend may reverse, while others indicate that the current trend is likely to continue.
Remember, no candlestick pattern guarantees a successful trade. Always combine these patterns with trend analysis, support and resistance, proper risk management, and confirmation from the next candle before making trading decisions.
Let’s explore the 15 most important candlestick patterns every Forex trader should know.
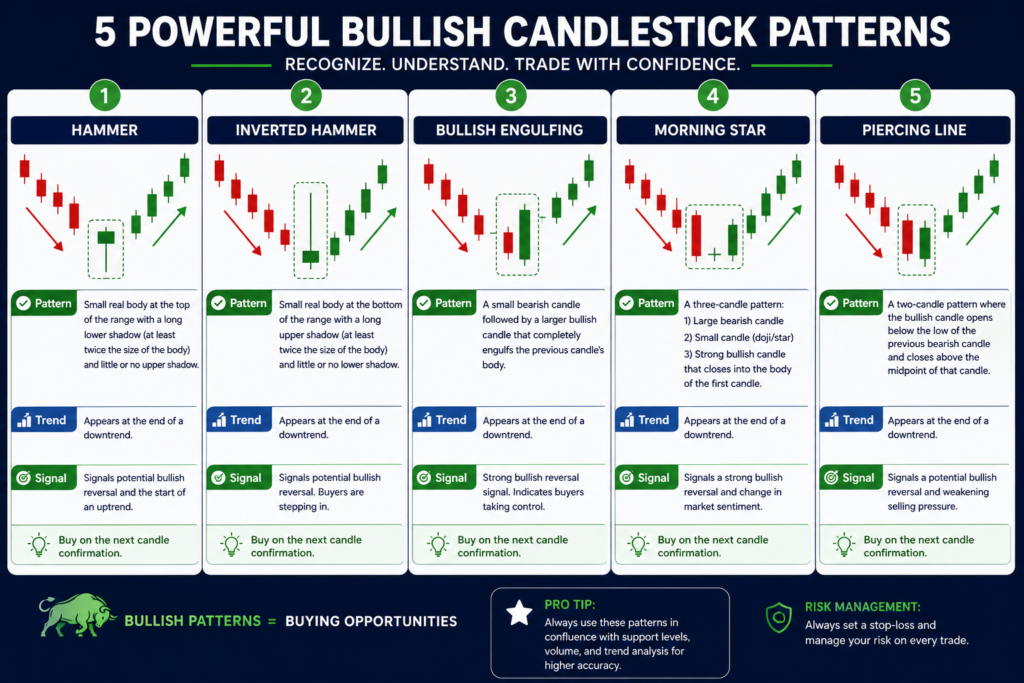
1. Hammer Pattern
What Is a Hammer?
The Hammer is one of the most popular bullish reversal candlestick patterns. It usually appears after a downtrend and suggests that selling pressure is weakening while buyers are beginning to regain control. Before placing a buy trade based on a Hammer pattern, always confirm that the market is approaching a significant support zone. Our Support and Resistance in Forex Trading guide explains how to identify these levels accurately.
The Hammer has:
- A small body near the top.
- A long lower shadow that is at least twice the size of the body.
- Little or no upper shadow.
Although sellers initially pushed prices significantly lower, buyers stepped in aggressively and drove prices back up before the candle closed. This indicates increasing buying strength.
Market Psychology
Imagine buyers and sellers competing.
- Sellers dominate the early part of the session.
- Price drops sharply.
- Buyers begin purchasing aggressively.
- The market closes near the opening price.
The long lower wick shows that buyers successfully rejected lower prices.
When It Appears
The Hammer is most reliable:
- After a strong downtrend.
- At major support levels.
- Near trendline support.
- Around Fibonacci retracement levels.
Practical Example
Suppose EUR/USD has been falling for several days.
Price reaches a strong support level at 1.1000.
A Hammer forms.
The following candle closes above the Hammer’s high.
This provides stronger confirmation that buyers may be taking control.
Beginner Mistake
Many beginners buy immediately after seeing a Hammer.
Professional traders usually wait for:
- Confirmation from the next candle.
- Strong support.
- Favorable risk-to-reward.
2. Inverted Hammer
What Is an Inverted Hammer?
The Inverted Hammer is another bullish reversal pattern.
Unlike the regular Hammer, it has:
- A small body near the bottom.
- A long upper shadow.
- Little or no lower shadow.
It also appears after a downtrend.
Market Psychology
During the session:
- Buyers push prices much higher.
- Sellers force prices back down.
- Even though sellers recover, buyers have demonstrated that they are becoming stronger.
This often signals that bullish momentum is beginning to build.
Best Location
The Inverted Hammer works best:
- At support levels.
- After prolonged declines.
- When confirmed by the following bullish candle.
Practical Example
GBP/USD has been declining for several sessions.
An Inverted Hammer appears at support.
The next candle closes strongly bullish.
This confirms increasing buying pressure.
Common Mistake
Entering before confirmation.
Always wait for the next candle to validate the reversal.
3. Bullish Engulfing Pattern
What Is a Bullish Engulfing Pattern?
The Bullish Engulfing pattern consists of two candlesticks. A Bullish Engulfing pattern becomes much more powerful when it appears in the direction of the prevailing trend. Learn how to identify market trends in our Trend Trading for Beginners guide.
The first candle is bearish.
The second candle is bullish and completely engulfs the body of the previous bearish candle.
It is considered one of the strongest bullish reversal signals.
Market Psychology
Initially, sellers remain in control.
However, buyers suddenly enter with overwhelming strength.
They completely reverse the previous session’s losses.
This shift often indicates a major change in market sentiment.
Best Trading Conditions
This pattern is strongest:
- After a downtrend.
- At major support.
- With increased buying momentum.
- Alongside other technical confirmations.
Example
USD/JPY falls toward a strong daily support level.
A Bullish Engulfing candle forms.
The next candle closes higher.
Many traders consider this a high-probability buying opportunity.
Beginner Mistake
Ignoring trend direction.
Bullish Engulfing patterns appearing during strong downtrends without support may fail.
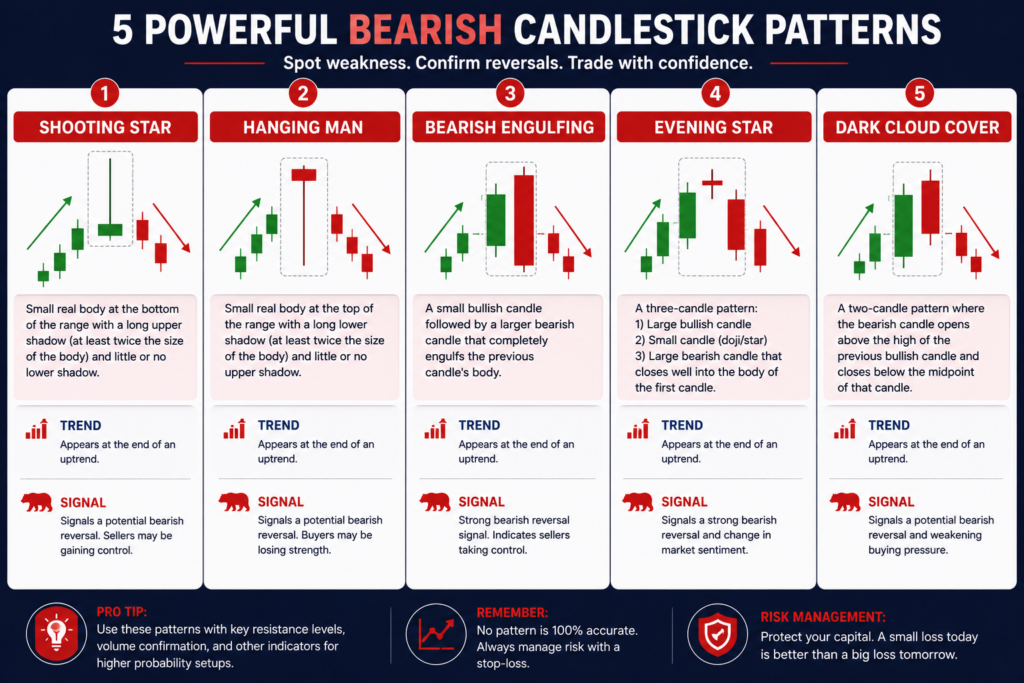
4. Bearish Engulfing Pattern
What Is a Bearish Engulfing Pattern?
The Bearish Engulfing pattern is the opposite of the Bullish Engulfing pattern. Never risk your entire trading account on a single candlestick pattern. Proper position sizing helps protect your capital during losing trades.
It consists of:
- A small bullish candle.
- Followed by a larger bearish candle that completely engulfs the previous candle’s body.
This indicates that sellers have taken control.
Market Psychology
Buyers initially appear confident.
Suddenly, sellers enter aggressively.
The market closes well below the previous candle.
This shift often signals increasing bearish momentum.
Best Location
The Bearish Engulfing pattern performs best:
- Near strong resistance.
- After an uptrend.
- Around psychological price levels.
Practical Example
EUR/USD rallies into resistance at 1.1350.
A Bearish Engulfing pattern forms.
The following candle confirms the reversal by closing lower.
This increases confidence in a potential selling opportunity.
Common Mistake
Selling immediately without confirmation.
Waiting for the next bearish candle helps filter out false signals.
5. Doji
What Is a Doji?
The Doji is one of the most recognizable candlestick patterns.
It forms when the opening and closing prices are nearly identical.
As a result, the candle has a very small body with upper and lower shadows that can vary in length.
The Doji represents indecision in the market.
Market Psychology
Neither buyers nor sellers manage to gain lasting control during the trading session.
Prices move up and down, but eventually close near where they started.
This often signals that momentum is weakening and that a significant move may be approaching.
When Is a Doji Important?
A Doji becomes much more meaningful when it appears:
- After a strong uptrend.
- After a strong downtrend.
- At major support or resistance.
- Before important economic news.
Practical Example
AUD/USD has been rising steadily for several days.
Near a major resistance level, a Doji forms.
The following candle closes bearish.
This combination suggests buyers may be losing momentum and that a reversal could be beginning.
Common Mistake
Many beginners assume every Doji is a reversal signal.
In reality, a Doji simply indicates indecision. Traders should always wait for confirmation from subsequent price action before entering a trade.
6. Morning Star
What Is a Morning Star?
The Morning Star is a powerful bullish reversal candlestick pattern that usually appears after a prolonged downtrend. It consists of three candlesticks and signals that sellers are losing momentum while buyers are beginning to take control.
The pattern includes:
- A large bearish candle.
- A small-bodied candle (which may be bullish, bearish, or a Doji).
- A large bullish candle that closes well into the body of the first bearish candle.
The Morning Star is named after the morning star that appears just before sunrise, symbolizing the end of darkness and the beginning of a new upward trend.
Market Psychology
The Morning Star tells the story of changing market sentiment.
- Sellers initially dominate, pushing prices lower.
- The second candle reflects hesitation and indecision as selling pressure weakens.
- Buyers then take control, driving prices higher and confirming the reversal.
This shift from fear to confidence often marks the beginning of a new bullish trend.
When Does It Appear?
The Morning Star is most reliable when it forms:
- After a strong downtrend.
- At a major support level.
- Near a Fibonacci retracement level.
- With increased buying momentum on the third candle.
Practical Example
Imagine GBP/USD has been declining for several days.
At a strong daily support level, a Morning Star pattern forms.
The third bullish candle closes above the midpoint of the first bearish candle.
Many traders view this as confirmation that buyers have regained control and may look for buying opportunities.
Beginner Mistake
Many traders enter after the second candle.
The safer approach is to wait until the third bullish candle closes, confirming the reversal.
7. Evening Star
What Is an Evening Star?
The Evening Star is the opposite of the Morning Star. It is a bearish reversal pattern that typically appears after an uptrend.
Like the Morning Star, it consists of three candles:
- A strong bullish candle.
- A small candle showing indecision.
- A strong bearish candle that closes deep into the first candle.
It signals that buyers are losing strength and sellers are beginning to dominate.
Market Psychology
Initially, buyers continue pushing prices upward.
The second candle shows uncertainty as buying momentum slows.
Finally, sellers overwhelm buyers and drive prices sharply lower.
This transition often marks the beginning of a bearish reversal.
Best Trading Conditions
The Evening Star is strongest:
- Near major resistance levels.
- After a prolonged uptrend.
- When accompanied by bearish confirmation from the following candle.
Practical Example
EUR/USD rallies toward a major resistance level.
An Evening Star forms.
The next candle closes lower.
This suggests sellers have taken control, increasing the probability of further downside movement.
Common Mistake
Selling immediately after spotting the second candle.
Professional traders usually wait for the bearish third candle to close before entering a trade.
8. Shooting Star
What Is a Shooting Star?
The Shooting Star is a bearish reversal candlestick that appears after an uptrend.
It has:
- A small body near the bottom.
- A long upper shadow.
- Little or no lower shadow.
Its appearance resembles an upside-down Hammer.
Market Psychology
Buyers initially push prices significantly higher.
However, sellers enter aggressively and force prices back down before the candle closes.
Although buyers attempted to continue the uptrend, sellers demonstrated that they were becoming stronger.
This often signals weakening bullish momentum.
Best Location
The Shooting Star performs best:
- At major resistance.
- After a strong bullish trend.
- Near psychological price levels.
- When confirmed by a bearish candle afterward.
Practical Example
USD/CAD has been climbing steadily.
A Shooting Star forms near a long-term resistance zone.
The following candle closes bearish.
This provides stronger confirmation of a potential reversal.
Beginner Mistake
Many traders mistake every Shooting Star for a sell signal.
Always evaluate the overall trend and nearby resistance before making a trading decision.
9. Hanging Man
What Is a Hanging Man?
The Hanging Man is another bearish reversal pattern.
It looks almost identical to the Hammer but appears after an uptrend, giving it a completely different meaning.
Characteristics include:
- Small body near the top.
- Long lower shadow.
- Little or no upper shadow.
Market Psychology
During the session:
- Sellers manage to push prices sharply lower.
- Buyers recover and close the candle near the opening price.
- Although buyers recover, the long lower shadow reveals that selling pressure is beginning to increase.
This serves as an early warning that the uptrend may be losing momentum.
Best Trading Conditions
The Hanging Man is most effective:
- After a prolonged uptrend.
- Near resistance.
- When confirmed by the next bearish candle.
Practical Example
AUD/USD reaches a significant resistance level.
A Hanging Man appears.
The following candle closes lower.
This confirms increasing selling pressure and may present a selling opportunity.
Common Mistake
Confusing the Hanging Man with the Hammer.
Remember:
- Hammer = after a downtrend (bullish)
- Hanging Man = after an uptrend (bearish)
The trend before the pattern is what determines its meaning.
10. Piercing Line
What Is a Piercing Line Pattern?
The Piercing Line is a bullish reversal pattern consisting of two candles.
The first candle is bearish.
The second candle opens below the previous candle’s low but closes above the midpoint of the bearish candle.
This indicates that buyers have regained significant control.
Market Psychology
Sellers begin the session confidently and push prices lower.
However, buyers enter aggressively and reverse much of the decline before the candle closes.
This sudden change in momentum often signals that bearish pressure is weakening.
Best Trading Conditions
The Piercing Line pattern works best:
- After a downtrend.
- At support.
- Alongside bullish confirmation from subsequent candles.
- When combined with other technical analysis tools.
Practical Example
USD/CHF declines toward a major support level.
A Piercing Line pattern forms.
The next candle continues moving higher.
This strengthens the probability of a bullish reversal.
Common Mistake
Entering immediately after the Piercing Line appears.
Waiting for confirmation from the next candle helps reduce false signals and improves trade quality.
Key Takeaways
The Morning Star, Evening Star, Shooting Star, Hanging Man, and Piercing Line are among the most reliable reversal patterns in Forex trading. However, their effectiveness depends heavily on market context, trend direction, and confirmation.
Successful traders do not rely solely on the appearance of these patterns. Instead, they combine them with support and resistance, trend analysis, and disciplined risk management to make informed trading decisions.
11. Practical Trading Example
Let’s see how candlestick patterns work in a real Forex trading scenario. Before entering any trade, it’s also wise to review the economic calendar for major news events that could increase market volatility and invalidate technical signals.
Scenario
Imagine you’re analyzing the EUR/USD currency pair on the 4-hour chart.
After several days of falling prices, EUR/USD reaches a major support level that has held multiple times in the past.
Suddenly, a Hammer candlestick forms.
Instead of entering the trade immediately, you wait for confirmation.
The next candle closes strongly bullish above the Hammer’s high.
You also notice:
- The overall market trend on the daily timeframe remains bullish.
- The Hammer formed exactly at a key support level.
- The Relative Strength Index (RSI) indicates the market was previously oversold.
- Your risk-to-reward ratio is approximately 1:3.
Trading Decision
You decide to:
- Enter a Buy position after confirmation.
- Place your Stop-Loss below the Hammer’s low.
- Set your Take-Profit near the next resistance level.
Because multiple factors support the trade—not just the candlestick pattern—you have a higher probability setup.
This example demonstrates why professional traders combine candlestick patterns with other technical analysis tools rather than relying on a single signal.
Common Mistakes Beginners Make
Many beginners lose money not because candlestick patterns don’t work, but because they misuse them. If you’re still practicing these concepts, consider using a demo account before trading with real money. Read our comparison of Demo Trading vs Live Trading to know when you’re ready to transition.
Avoid these common mistakes:
1. Trading Every Pattern
Not every candlestick pattern deserves a trade.
Always consider the market context before entering.
2. Ignoring the Overall Trend
Bullish reversal patterns perform much better during uptrends.
Bearish patterns are generally more reliable during downtrends.
Trading against the trend significantly increases risk.
3. Ignoring Support and Resistance
A Hammer in the middle of nowhere has far less significance than one appearing at a major support level.
Location matters just as much as the pattern itself.
4. Entering Without Confirmation
Professional traders usually wait for the next candle to confirm the signal.
Patience often helps avoid false breakouts and unnecessary losses.
5. Trading Without a Stop-Loss
Even the strongest candlestick pattern can fail.
Always protect your trading capital by using an appropriate Stop-Loss order.
6. Risking Too Much on One Trade
Never risk a large percentage of your account on a single setup.
Many experienced traders risk only 1% to 2% of their trading capital per trade.
Tips for Using Candlestick Patterns Successfully
To improve your trading decisions:
- Study one pattern at a time before learning the next.
- Practice on a demo account before trading with real money.
- Combine candlestick patterns with support and resistance.
- Analyze higher timeframes before entering trades.
- Wait patiently for confirmation.
- Follow a written trading plan.
- Maintain proper risk management.
- Keep a trading journal to review your decisions and improve over time.
Consistency and discipline are often more important than finding the “perfect” candlestick pattern. Many successful traders also keep a trading journal and continuously improve their trading psychology, discipline, and emotional control.
Frequently Asked Questions (FAQs)
1. Which candlestick pattern is the most reliable?
There is no single “best” candlestick pattern. However, the Bullish Engulfing, Bearish Engulfing, Hammer, Morning Star, and Evening Star are among the most reliable when combined with proper confirmation and market context.
2. Can I trade using candlestick patterns alone?
No. Candlestick patterns should be combined with trend analysis, support and resistance, risk management, and confirmation signals to improve trading accuracy.
3. Which timeframe works best for candlestick patterns?
Candlestick patterns can be used on any timeframe. However, many traders consider the 4-hour and daily charts more reliable because they contain less market noise than lower timeframes.
4. Do candlestick patterns work for all currency pairs?
Yes. Candlestick patterns work across all major, minor, and exotic currency pairs because they reflect market psychology rather than a specific asset.
5. How long does it take to master candlestick patterns?
Learning the patterns may take only a few weeks, but becoming consistently profitable requires regular practice, patience, and disciplined risk management.
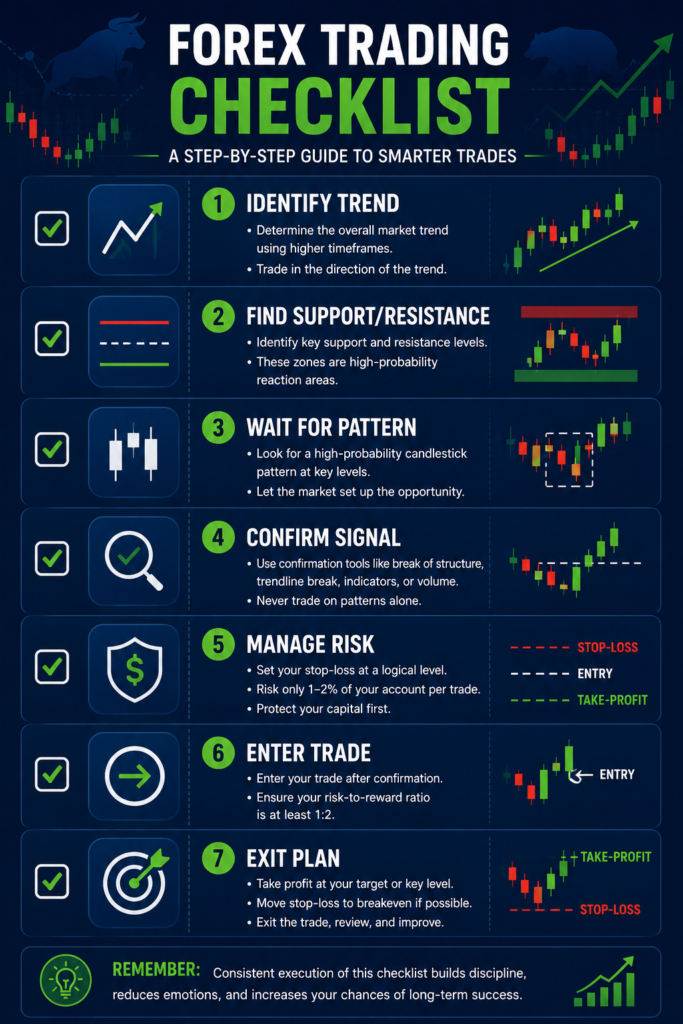
Final Thoughts
Candlestick patterns are one of the most valuable tools every Forex trader should learn. They provide a visual representation of market psychology, helping traders identify potential reversals, trend continuation opportunities, and periods of market indecision. As you continue learning, remember that candlestick patterns are just one piece of the puzzle. Explore our beginner guides on technical analysis, support and resistance, trend trading, and position sizing to build a complete Forex trading foundation.
However, successful trading is not about memorizing patterns. It is about understanding the story each candlestick tells and interpreting that story within the broader market context.
By combining candlestick patterns with trend analysis, support and resistance, proper position sizing, and sound risk management, you can significantly improve your ability to make informed trading decisions.
Remember that no trading strategy guarantees profits. Every trade carries risk, and losses are a normal part of trading. The goal is not to win every trade but to develop consistency, discipline, and a long-term approach to managing risk.
With continuous practice and experience, candlestick patterns can become one of the most powerful tools in your Forex trading journey.
Risk Disclaimer
Disclaimer: The information provided in this article is for educational purposes only and should not be considered financial or investment advice. Forex trading involves substantial risk and may not be suitable for all investors. Past market performance does not guarantee future results. Always conduct your own research, practice on a demo account, and consult a qualified financial advisor before making trading decisions. Before trading with real money, make sure you understand the risks involved. The U.S. Commodity Futures Trading Commission (CFTC) offers valuable educational resources on Forex trading risks and investor protection.
Continue Your Forex Learning Journey
Ready to improve your Forex trading skills?
Explore more beginner-friendly guides on BuildSmartAfri to strengthen your trading knowledge:
- Learn how to identify Support and Resistance.
- Master Trend Trading strategies.
- Discover Position Sizing techniques for effective risk management.
- Understand how to use an Economic Calendar before placing trades.
If you found this guide helpful, share it with fellow traders and bookmark BuildSmartAfri for more practical Forex tutorials, trading strategies, and educational resources designed to help you trade with greater confidence.