
What Is Multiple Timeframe Analysis?
Successful Forex traders rarely make trading decisions by looking at a single chart. Instead, they analyze the market across different timeframes to gain a clearer understanding of the overall trend, identify key support and resistance levels, and pinpoint precise entry and exit opportunities. This approach is known as multiple timeframe analysis. Learn more about multiple timeframe analysis.
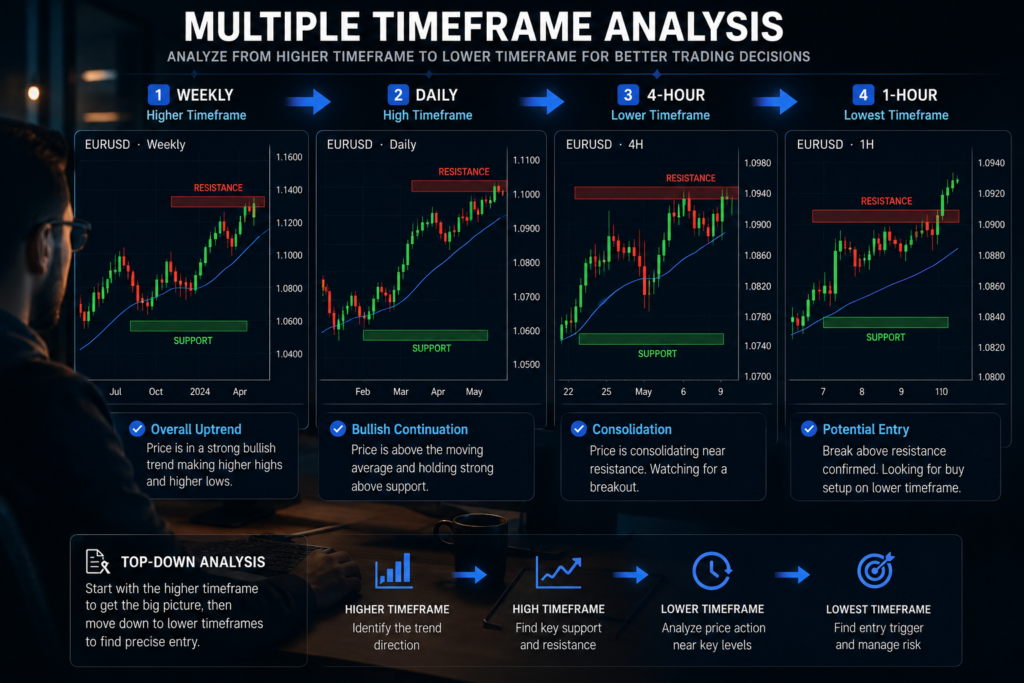
Multiple timeframe analysis is the process of examining the same currency pair on two or more different chart timeframes before entering a trade. By comparing the bigger picture with shorter-term price movements, traders can reduce uncertainty and make more informed trading decisions.
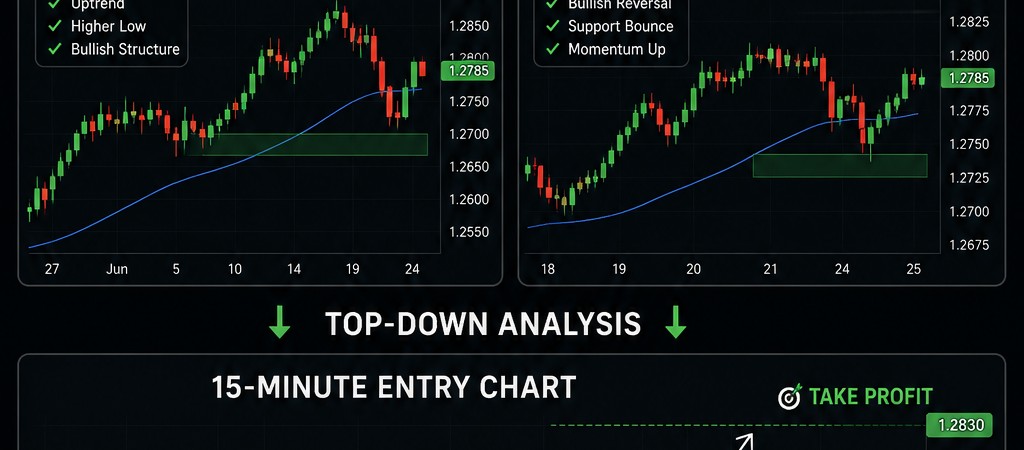
For example, a trader might begin by checking the Daily (D1) chart to determine the long-term market trend. If the Daily chart shows a strong uptrend, they may then move to the 4-hour (H4) chart to identify important support and resistance levels. Finally, they can switch to the 1-hour (H1) or 15-minute (M15) chart to wait for a high-probability entry signal, such as a bullish engulfing candle or a breakout followed by a successful retest.
This method is often called top-down analysis because traders start with the highest timeframe and gradually work their way down to lower timeframes. Instead of guessing where the market may move next, they use information from multiple perspectives to confirm the strength and direction of a potential trade.
One of the biggest advantages of multiple timeframe analysis is that it helps traders avoid taking positions against the dominant market trend. A trade that looks attractive on a 15-minute chart may actually be moving directly into a strong resistance level visible on the Daily chart. By analyzing multiple timeframes first, traders can avoid these costly mistakes and focus on opportunities with a higher probability of success.
Imagine you’re planning a road trip. Before driving through city streets, you first look at a map of the entire country to understand the overall route. Next, you check the roads in your region, and finally, you use GPS navigation to reach your exact destination. Multiple timeframe analysis works in much the same way. The higher timeframe provides the overall market direction, the medium timeframe highlights important trading zones, and the lower timeframe helps you execute the trade with greater precision.
Whether you are a beginner or an experienced trader, learning to analyze multiple timeframes can significantly improve your market understanding, trading confidence, and risk management. It allows you to trade with the trend rather than against it, filter out low-quality setups, and increase the likelihood of making disciplined, well-planned trading decisions.
In the following sections, you’ll learn why multiple timeframe analysis is so important, how to choose the best timeframe combinations, and how to apply this powerful technique step by step using practical Forex trading examples.
Why Multiple Timeframe Analysis Matters
Many beginner Forex traders make the mistake of relying on a single chart timeframe when making trading decisions. They may spot what appears to be a strong buying opportunity on a 15-minute chart, only to see the trade fail because the overall market trend on the Daily chart is bearish. This often leads to unnecessary losses, frustration, and confusion. Learn how central bank decisions can influence currency prices.
Multiple timeframe analysis helps solve this problem by allowing traders to view the market from different perspectives before entering a trade. Instead of focusing only on short-term price movements, traders can understand the broader market trend, identify important price levels, and find more accurate entry points.
Think of multiple timeframe analysis as putting together pieces of a puzzle. Each timeframe provides valuable information, but no single chart tells the complete story. When you combine higher, medium, and lower timeframes, you gain a clearer picture of market conditions and can make more confident trading decisions.
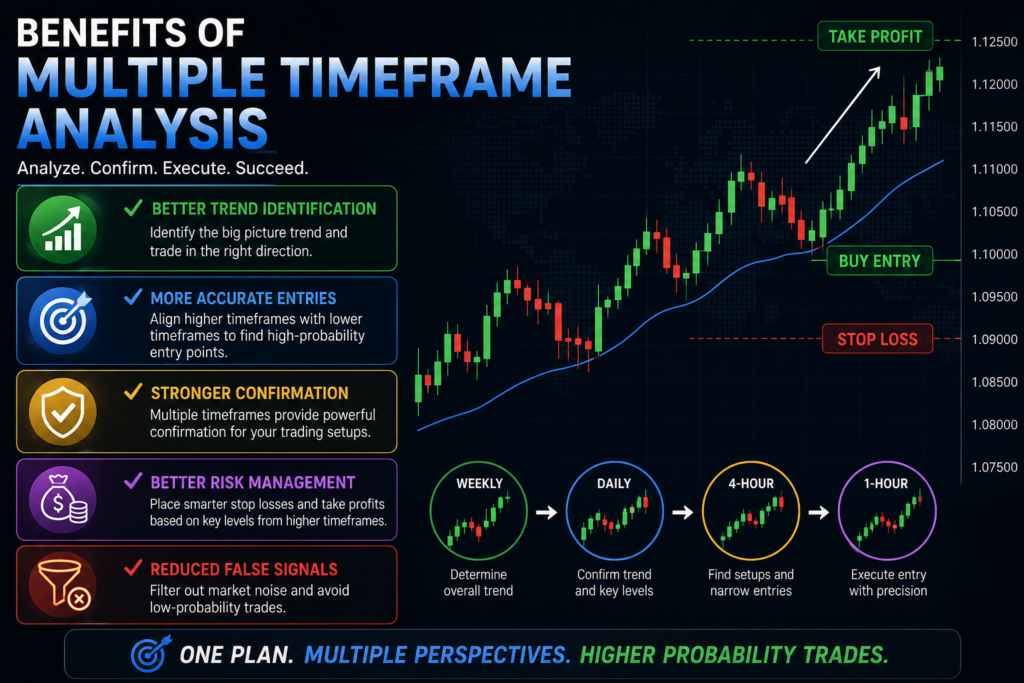
1. Helps You Identify the Overall Market Trend
The primary advantage of multiple timeframe analysis is that it helps traders determine the dominant market trend. Higher timeframes, such as the Daily (D1) or Weekly (W1) chart, filter out much of the market noise found on lower timeframes. This makes it easier to identify whether buyers or sellers are in control.
For example:
- If the Daily chart is making higher highs and higher lows, the market is in an uptrend.
- If the Daily chart is making lower highs and lower lows, the market is in a downtrend.
Trading in the direction of the larger trend generally provides a higher probability of success than trading against it.
2. Improves Entry Timing
Even when you correctly identify the overall trend, entering at the wrong time can still lead to losses. Lower timeframes help traders wait for better confirmation before opening a position.
For example, suppose the Daily chart shows a strong uptrend. Instead of buying immediately, you switch to the 1-hour chart and wait for:
- A pullback to a support level
- A bullish candlestick pattern
- A breakout followed by a successful retest
This approach often results in better entry prices and more favorable risk-to-reward ratios.
3. Confirms Trading Signals
Many technical signals appear reliable on a single timeframe but lose their strength when viewed across multiple charts.
Imagine you see a bullish engulfing pattern on the 15-minute chart. Before entering the trade, you check the 4-hour chart and discover that price is approaching a major resistance level. This additional information suggests the trade has a lower probability of succeeding.
By confirming signals across different timeframes, traders can avoid weak setups and focus only on high-quality opportunities.
4. Reduces False Signals
Lower timeframes often contain significant market noise, resulting in false breakouts, fake reversals, and misleading candlestick patterns.
Higher timeframes smooth out these random price fluctuations, making it easier to distinguish genuine trends from temporary market movements.
This helps traders avoid entering trades based on short-lived price spikes or emotional market reactions.
5. Enhances Risk Management
Multiple timeframe analysis also improves risk management. When traders know the broader market direction and identify strong support and resistance levels, they can place stop-loss and take-profit orders more strategically.
Instead of placing a stop loss too close to the entry point, traders can position it beyond significant market structure identified on higher timeframes. This reduces the likelihood of being stopped out by normal market fluctuations.
Practical Example
Suppose you’re analyzing the EUR/USD currency pair:
- Daily Chart: Strong uptrend with higher highs and higher lows.
- 4-Hour Chart: Price pulls back to a key support level.
- 1-Hour Chart: A bullish engulfing candlestick forms, confirming buyers are returning.
Because all three timeframes align, this setup provides much stronger confirmation than relying on the 1-hour chart alone.
Key Takeaway
Multiple timeframe analysis helps traders:
- Identify the dominant market trend.
- Improve trade timing.
- Confirm technical signals.
- Filter out false setups.
- Manage risk more effectively.
- Trade with greater confidence and discipline.
By combining information from different timeframes, traders can make better-informed decisions instead of relying on a single chart. In the next section, we’ll explore the most common Forex timeframes and explain how each one serves a unique purpose in the trading process.
Understanding Forex Timeframes
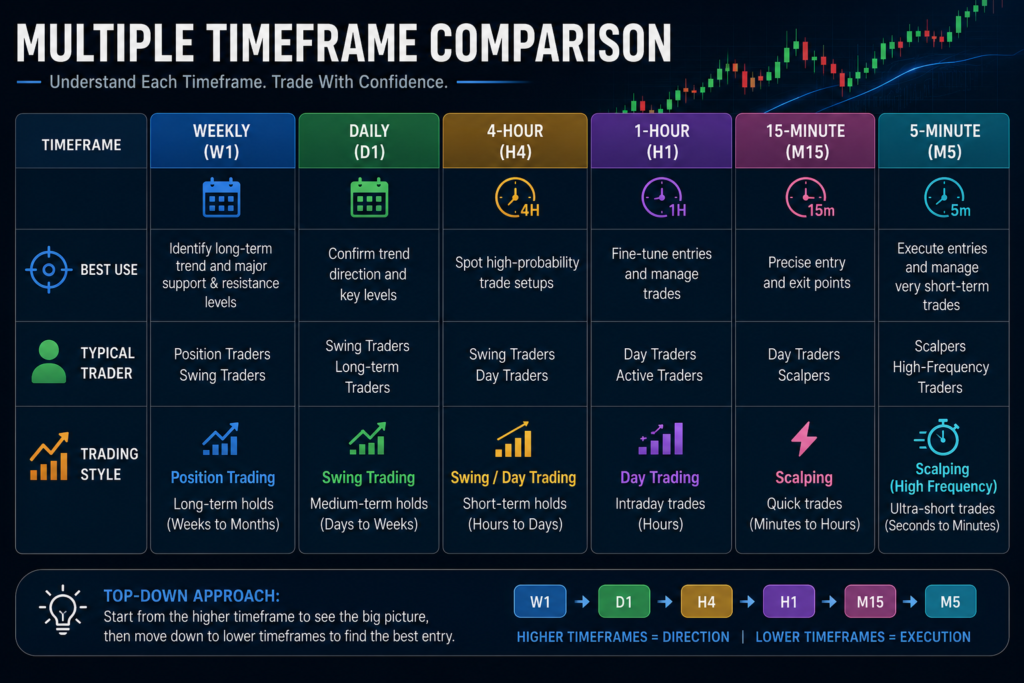
Before you can successfully use multiple timeframe analysis, it’s important to understand what Forex timeframes are and how each one serves a different purpose. A timeframe represents the amount of time covered by a single candlestick or price bar on a chart. For example, on a 1-hour (H1) chart, each candlestick shows one hour of price movement. On a Daily (D1) chart, each candlestick represents an entire trading day. Practice your analysis using live Forex charts.
Every timeframe provides a unique perspective on the market. Higher timeframes reveal the overall trend and major market structure, while lower timeframes offer more detailed price action for finding precise trade entries and exits.
Common Forex Timeframes
Forex trading platforms typically offer several standard timeframes, including:
| Timeframe | Best For | Typical Traders |
|---|---|---|
| 1 Minute (M1) | Very short-term scalping | Professional scalpers |
| 5 Minutes (M5) | Scalping | Day traders |
| 15 Minutes (M15) | Short-term entries | Day traders |
| 30 Minutes (M30) | Intraday analysis | Day traders |
| 1 Hour (H1) | Trade entries and short-term trends | Swing traders |
| 4 Hours (H4) | Market structure and trend confirmation | Swing traders |
| Daily (D1) | Long-term trend analysis | Swing and position traders |
| Weekly (W1) | Major support and resistance | Long-term investors |
| Monthly (MN) | Overall market direction | Institutional traders and investors |
Each timeframe has its strengths and weaknesses. Choosing the right combination depends on your trading style and objectives.
Lower Timeframes
Lower timeframes, such as the M5, M15, and M30 charts, display detailed price movements. They are ideal for identifying precise entry points, but they also contain more market noise and false signals.
For example, a breakout on a 15-minute chart may appear convincing, yet it could simply be a temporary price fluctuation if the higher timeframes show strong resistance nearby.
Lower timeframes are best used after you’ve already confirmed the overall trend using higher timeframes.
Medium Timeframes
Charts like the H1 and H4 strike a balance between detail and reliability. They help traders identify:
- Trend continuation opportunities
- Pullbacks
- Chart patterns
- Support and resistance zones
- Breakouts and retests
Many swing traders rely heavily on the 4-hour chart because it filters out much of the market noise while still providing enough trading opportunities throughout the week.
Higher Timeframes
Higher timeframes, including the Daily, Weekly, and Monthly charts, provide the clearest view of the market’s overall direction.
These charts help traders identify:
- Major trends
- Long-term support and resistance
- Market structure
- Institutional buying and selling areas
Because higher timeframes contain more historical price data, they generally produce stronger and more reliable trading signals than lower timeframes.
Why Different Timeframes Can Show Different Trends
One of the most confusing aspects for beginners is that a currency pair can appear to be trending in opposite directions depending on the timeframe.
For example:
- Daily Chart: Strong uptrend.
- 4-Hour Chart: Temporary pullback.
- 1-Hour Chart: Beginning to reverse upward.
- 15-Minute Chart: Small downtrend.
This doesn’t mean the charts are contradicting each other. Instead, they are showing different stages of the same market movement.
Imagine climbing a mountain. From a distance, the mountain slopes upward. As you hike, however, you’ll encounter small downhill sections before continuing upward. The Forex market behaves in a similar way—lower timeframes often display temporary pullbacks within a larger trend visible on higher timeframes.
Which Timeframes Should Beginners Use?
Beginners should avoid monitoring too many charts at once. A simple three-timeframe approach is often the most effective:
- Daily (D1): Determine the overall market trend.
- 4-Hour (H4): Identify important support and resistance levels.
- 1-Hour (H1): Look for entry signals using price action or candlestick patterns.
This combination provides a clear balance between long-term market direction and precise trade execution while reducing unnecessary confusion.
Key Takeaway
Understanding how different Forex timeframes work is the foundation of successful multiple timeframe analysis. Each timeframe tells part of the market’s story, but no single chart provides the complete picture. By learning when and how to use higher, medium, and lower timeframes together, you can improve trend identification, reduce false signals, and make more confident trading decisions.
In the next section, you’ll learn one of the most effective techniques used by professional traders: the Top-Down Analysis Method, a step-by-step process for analyzing the market from higher timeframes down to your trade entry chart.
The Top-Down Analysis Method
The Top-Down Analysis Method is a step-by-step approach where traders begin analyzing the market from a higher timeframe before moving down to lower timeframes to find the best trade entry. Analyze different timeframes using TradingView’s interactive charts.
Think of it as seeing the big picture before focusing on the details.
Instead of opening a 15-minute chart and placing a trade immediately, professional traders first ask:
- What is the overall market trend?
- Where are the major support and resistance levels?
- Is the market moving with buyers or sellers?
- Where is the safest place to enter?
Frequently Asked Questions (FAQs)
1. What is multiple timeframe analysis in Forex?
Multiple timeframe analysis is the process of analyzing the same currency pair on two or more different chart timeframes to understand the overall market trend, identify key support and resistance levels, and find accurate trade entry and exit points.
2. Which timeframes should beginners use?
A popular combination for beginners is:
- Daily (D1): Overall market trend
- 4-Hour (H4): Key support and resistance
- 1-Hour (H1): Trade entries
This approach provides a balanced view of the market without becoming overwhelming.
3. Can I trade using only one timeframe?
Yes, but it’s generally less effective. Relying on a single timeframe may cause you to miss important market context, increasing the chances of trading against the dominant trend or entering at poor price levels.
4. What is top-down analysis?
Top-down analysis is a trading method where you begin with higher timeframes to determine the overall market direction before moving to lower timeframes to identify precise entry opportunities.
5. Is multiple timeframe analysis suitable for all trading styles?
Yes. Scalpers, day traders, swing traders, and position traders can all benefit from multiple timeframe analysis. The timeframe combinations simply vary depending on the trading style.
6. Does multiple timeframe analysis guarantee profitable trades?
No. While it can improve the quality of your trading decisions, it does not eliminate risk. Successful Forex trading still requires proper risk management, discipline, and continuous learning.
Final Thoughts
Multiple timeframe analysis is one of the most effective techniques a Forex trader can learn. Rather than relying on a single chart, it helps you understand the market from different perspectives, identify the dominant trend, and find higher-probability trade entries.
Remember that successful trading isn’t about predicting every market move—it’s about stacking the odds in your favor. By combining higher, medium, and lower timeframes, you can avoid trading against the prevailing trend, filter out weak setups, and make more confident, disciplined decisions.
As a beginner, keep your analysis simple. A practical combination like the Daily (D1) chart for identifying the overall trend, the 4-Hour (H4) chart for finding key support and resistance levels, and the 1-Hour (H1) chart for trade entries is more than enough to build consistency.
Like any trading skill, mastering multiple timeframe analysis requires patience and practice. Spend time reviewing historical charts, test your strategy on a demo account, and maintain a trading journal to evaluate your progress. The more experience you gain, the easier it becomes to recognize high-quality trading opportunities.
Above all, remember that no strategy guarantees profits. Even the best trade setups can fail due to unexpected market events. That’s why combining multiple timeframe analysis with sound risk management, proper position sizing, and emotional discipline is essential for long-term success.
Risk Disclaimer
Disclaimer: Forex trading involves a high level of risk and may not be suitable for all investors. Currency prices can be highly volatile, and you may lose part or all of your invested capital. The information provided in this article is for educational purposes only and should not be considered financial, investment, or trading advice. Always conduct your own research, use proper risk management, and consult a qualified financial advisor before making any investment decisions. Past performance is not a reliable indicator of future results. Review the CFTC’s investor education resources to better understand the risks of Forex trading.
Continue Learning with BuildSmartAfri
Ready to take your Forex trading skills to the next level?
BuildSmartAfri offers practical, beginner-friendly guides designed to help you understand the Forex market with confidence. Continue your learning journey by exploring our in-depth articles on Price Action Trading, Support and Resistance, Candlestick Patterns, Risk Management, Trend Trading, and many more essential Forex topics.