
Introduction:
How to read Forex charts is one of the most important skills every trader must learn before entering the Forex market. Regardless of the trading strategy you use, your ability to understand and interpret charts will significantly influence your trading decisions. Before learning how to read charts, beginners should understand important Forex concepts such as currency pairs, pips, spreads, and leverage.
Forex charts are visual representations of currency pair price movements over time. They allow traders to analyze historical price behavior, identify trends, spot potential trading opportunities, and make informed decisions. Without understanding charts, trading becomes little more than guessing. Forex trading basics for beginners
Many beginners feel overwhelmed when they first see a Forex chart filled with lines, candles, numbers, and indicators. However, once you understand the basic components of a chart, reading Forex charts becomes much easier.
Learning how to read Forex charts can help traders understand market direction, recognize important price levels, and improve overall trading confidence. Whether you are interested in day trading, swing trading, or long-term investing, chart reading is a fundamental skill that every Forex trader should master.
In this guide, you will learn what Forex charts are, the different types of charts used in trading, how to identify trends, understand timeframes, and avoid common chart-reading mistakes.
What Is a Forex Chart?
A Forex chart is a graphical representation of the price movements of a currency pair over a specific period of time. Forex charts display the price movement of currency pairs and help traders analyze market behavior.
For example:
- EUR/USD
- GBP/USD
- USD/JPY
- AUD/USD
Each chart displays how the value of one currency changes relative to another.
Forex charts record and display price data, helping traders visualize market activity. Instead of looking at endless rows of numbers, traders can use charts to quickly identify patterns and market trends.
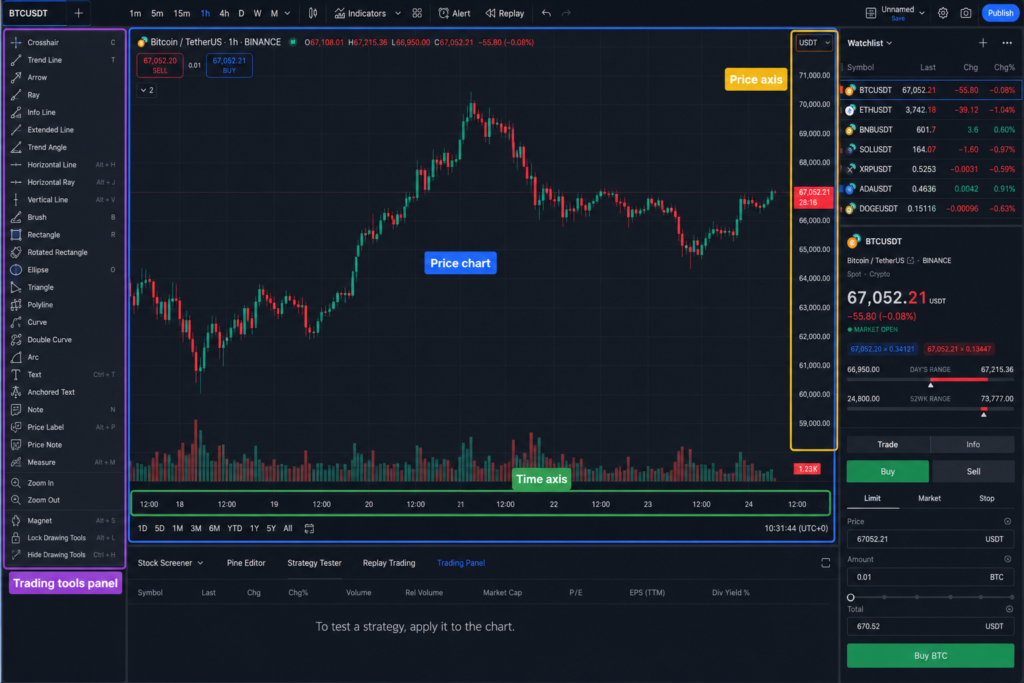
Every Forex chart contains two main elements:
Price Axis
The vertical axis shows the price of the currency pair.
Time Axis
The horizontal axis shows the passage of time.
Together, these axes create a visual representation of how prices change over time.
For example, if the EUR/USD chart moves upward, it indicates that the Euro is strengthening against the US Dollar. If the chart moves downward, it indicates that the Euro is weakening against the US Dollar.
Why Forex Charts Are Important
Forex charts are essential because they provide valuable information about market behavior.
Without charts, traders would struggle to understand:
- Current market conditions
- Historical price movements
- Potential future trends
- Key support and resistance levels
- Market momentum
Charts help traders make data-driven decisions rather than emotional decisions.
Successful traders rely heavily on chart analysis because price movements often reveal important clues about market sentiment and potential trading opportunities.
Learning to read charts correctly can help improve discipline, confidence, and overall trading performance.
Types of Forex Charts
There are three primary chart types used in Forex trading:
- Line Charts
- Bar Charts
- Candlestick Charts
Each chart type displays information differently.
Line Charts
Line charts are the simplest type of Forex chart.
They are created by connecting closing prices with a continuous line.
Line charts help traders quickly identify:
- Overall market direction
- Long-term trends
- General price movement
Advantages:
- Easy to understand
- Ideal for beginners
- Removes market noise
Disadvantages:
- Limited information
- Does not show opening, high, or low prices
Although professional traders often prefer more detailed charts, line charts are excellent for learning basic chart-reading skills.
Bar Charts
Bar charts provide more information than line charts.
Each bar represents:
- Opening price
- Closing price
- Highest price
- Lowest price
This information allows traders to analyze price action more effectively.
Advantages:
- More detailed than line charts
- Displays important price information
Disadvantages:
- More difficult for beginners to read
Bar charts are commonly used by experienced traders who want additional market detail.
Candlestick Charts
Candlestick charts are the most popular chart type in Forex trading.
Each candlestick shows:
- Opening price
- Closing price
- Highest price
- Lowest price
A candlestick consists of:
Body
The body represents the distance between the opening and closing prices.
Wick (Shadow)
The wick shows the highest and lowest prices reached during the selected period.
Candlesticks provide visual clues about market sentiment and are widely used for technical analysis.
Most Forex traders use candlestick charts because they offer the best balance between simplicity and information.
Understanding Price Movements
Forex prices constantly move because of changes in supply and demand. Price movements are often measured in pips, which represent the smallest price change in most currency pairs.
When more traders want to buy a currency pair than sell it, prices rise.
When more traders want to sell than buy, prices fall. Forex economic calendar
These movements create patterns that traders analyze using charts.
Understanding price movement helps traders identify:
- Trends
- Reversals
- Breakouts
- Consolidation periods
Even small movements can create trading opportunities when combined with proper analysis and risk management.
Understanding Timeframes
A timeframe determines how much time each chart bar or candlestick represents. Different trading platforms allow traders to switch between multiple chart timeframes.
Common Forex timeframes include:
1 Minute (M1)
Each candle represents one minute.
Typically used by scalpers.
5 Minute (M5)
Each candle represents five minutes.
Popular among short-term traders.
15 Minute (M15)
Often used for intraday trading.
1 Hour (H1)
Common among day traders.
4 Hour (H4)
Popular with swing traders.
Daily (D1)
Each candle represents one day.
Useful for long-term trend analysis.
Weekly and Monthly
Used for identifying major market trends.
Beginners often find H4 and Daily charts easier to analyze because they contain less market noise. live Forex chart analysis tools
Bullish vs Bearish Trends
One of the most important skills in reading Forex charts is the ability to identify market trends. A trend represents the overall direction in which a currency pair is moving over a period of time. Understanding trends helps traders align their trades with the market rather than trading against it. Traders often use stop losses when trading trends to protect their capital if the market moves against them.
Markets generally move in three directions:
- Upward (Bullish Trend)
- Downward (Bearish Trend)
- Sideways (Range or Consolidation)
Recognizing these market conditions can help traders make better decisions about when to enter and exit trades.
Bullish Trend (Uptrend)
A bullish trend occurs when the price of a currency pair is consistently moving higher over time. In an uptrend, buyers dominate the market and push prices upward. This usually happens when traders are optimistic about a particular currency’s future value.
A bullish trend is characterized by:
- Higher highs
- Higher lows
- Strong buying momentum
- Positive market sentiment
For example, if EUR/USD rises from 1.0800 to 1.1000, pulls back slightly to 1.0950, and then rises again to 1.1200, the market is demonstrating a bullish trend because each new high and low is higher than the previous one.
Many traders prefer trading in the direction of an uptrend because it increases the probability of success. Instead of trying to predict reversals, they look for opportunities to buy when prices temporarily pull back before continuing higher.
Bullish trends are often supported by strong economic data, rising interest rates, political stability, or increased investor confidence in a country’s economy.
Bearish Trend (Downtrend)
A bearish trend occurs when prices consistently move lower over time. In a downtrend, sellers dominate the market and push prices downward. This typically reflects negative sentiment toward a particular currency.
Characteristics of a bearish trend include:
- Lower highs
- Lower lows
- Strong selling pressure
- Negative market sentiment
For example, if GBP/USD falls from 1.3000 to 1.2800, rebounds slightly to 1.2900, and then drops again to 1.2600, the market is demonstrating a bearish trend.
During bearish conditions, many traders focus on selling opportunities rather than buying opportunities. They attempt to enter trades in the direction of the dominant trend rather than fighting against market momentum.
Bearish trends can be influenced by weak economic performance, political uncertainty, lower interest rates, or negative market expectations.
Sideways Markets
Not every market moves in a clear upward or downward direction. Sometimes prices fluctuate within a relatively narrow range without establishing a strong trend.
This condition is known as:
- Consolidation
- Sideways market
- Range-bound market
During consolidation, buyers and sellers are relatively balanced. Prices repeatedly move between support and resistance levels without making significant progress in either direction.
Many beginners struggle during ranging markets because trend-following strategies often become less effective. Understanding when the market is trending and when it is consolidating is a valuable chart-reading skill that improves over time with practice.
Understanding Support and Resistance Levels
Support and resistance are two of the most important concepts in technical analysis. They help traders identify areas where price may stop, reverse, or accelerate. Support and resistance levels are often used alongside proper risk management techniques.
These levels exist because traders often remember important price zones where buying or selling previously occurred.
What Is Support?
Support is a price level where buying pressure tends to overcome selling pressure. When prices approach support, many traders view the currency pair as relatively inexpensive and begin buying.
As more buyers enter the market:
- Demand increases
- Selling pressure decreases
- Prices often bounce upward
Think of support as a floor beneath the market. Just as a ball dropped onto a floor may bounce upward, prices often react similarly when they reach strong support levels.
For example, if EUR/USD repeatedly falls to 1.0800 and then moves higher, traders may identify 1.0800 as a support level.
Support levels are important because they can provide:
- Potential buying opportunities
- Stop-loss placement areas
- Market structure insights
What Is Resistance?
Resistance is the opposite of support.
Resistance is a price level where selling pressure tends to overcome buying pressure. When prices approach resistance, many traders view the currency pair as relatively expensive and begin selling.
As more sellers enter the market:
- Supply increases
- Buying pressure weakens
- Prices often move downward
Think of resistance as a ceiling above the market. Just as a ball thrown upward may hit the ceiling and fall back down, prices often react similarly when they reach strong resistance levels.
For example, if EUR/USD repeatedly rises to 1.1000 but struggles to move higher, traders may identify 1.1000 as a resistance level.
Resistance levels help traders identify:
- Potential selling opportunities
- Profit targets
- Areas of increased market activity
Why Support and Resistance Matter
Support and resistance levels are widely followed by traders because they frequently influence market behavior.
They help traders:
- Identify possible entry points
- Determine stop-loss placement
- Set profit targets
- Understand market structure
- Improve risk management decisions
While support and resistance do not guarantee reversals, they often serve as valuable reference points for technical analysis.
How Beginners Should Read Forex Charts
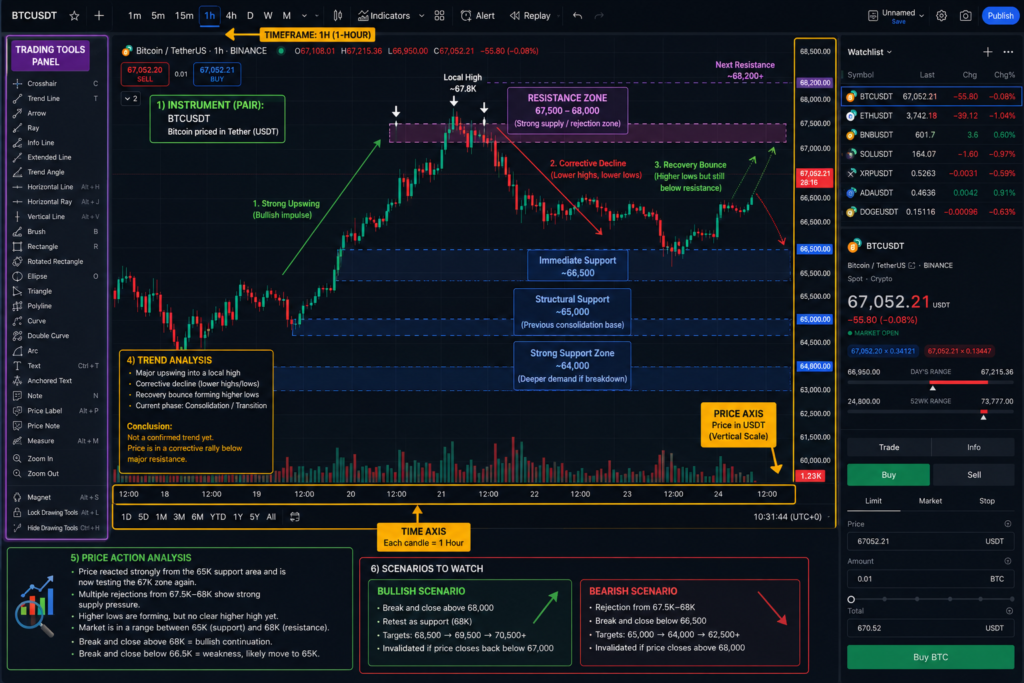
Reading Forex charts can seem overwhelming at first, but beginners can simplify the process by following a structured approach. Before analyzing charts, traders need a funded trading account with a reliable Forex broker.
Rather than trying to analyze every detail at once, focus on understanding the overall market picture. MetaTrader trading platform
Step 1: Identify the Currency Pair
The first step is knowing exactly which currency pair you are analyzing.
Examples include:
- EUR/USD
- GBP/USD
- USD/JPY
- AUD/USD
Each currency pair behaves differently and may react to different economic events. Understanding the pair helps provide context for price movements.
Step 2: Choose an Appropriate Timeframe
Your timeframe influences how you view the market.
Many beginners benefit from using:
- 4-Hour Charts (H4)
- Daily Charts (D1)
These higher timeframes often provide clearer trends and reduce the market noise that exists on lower timeframes.
Step 3: Identify the Overall Trend
Before looking for trading opportunities, determine whether the market is:
- Bullish
- Bearish
- Sideways
Trading with the trend is often easier than trading against it.
Step 4: Mark Support and Resistance Levels
Locate important price zones where the market has historically reacted.
These areas often influence future price behavior and can help traders identify high-probability trading opportunities.
Step 5: Analyze Price Action
Observe how price behaves around important levels.
Look for:
- Strong momentum moves
- Rejections
- Breakouts
- Pullbacks
- Consolidation patterns
Price action provides valuable information about buyer and seller behavior.
Step 6: Combine Analysis with Risk Management
Even the best chart analysis cannot guarantee profitable trades.
Always protect your account by:
- Using stop losses
- Managing position sizes
- Avoiding excessive leverage
- Following a trading plan
Successful traders focus not only on finding opportunities but also on controlling risk when trades do not go as expected.
Step 7: Practice Consistently
Chart-reading skills develop over time through observation and practice.
The more charts you study, the easier it becomes to recognize trends, patterns, and market structure. Consistency is often more important than complexity when learning technical analysis.
Many successful traders spend years refining their chart-reading abilities, and beginners should view the learning process as a gradual journey rather than a race.
Final Thoughts
Learning how to read Forex charts is one of the most valuable skills a trader can develop. While many beginners focus on finding the perfect trading strategy or the best indicators, successful traders understand that the foundation of good trading starts with understanding price movement and market structure.
Forex charts provide a visual representation of what buyers and sellers are doing in the market. By learning how to interpret chart patterns, trends, support and resistance levels, and price action, traders can make more informed decisions rather than relying on emotions or guesswork. The ability to read charts effectively allows traders to identify opportunities, manage risk, and develop confidence in their trading approach.
It is important to remember that chart reading is not about predicting the future with absolute certainty. No chart, indicator, or trading system can guarantee profitable trades every time. Instead, chart analysis helps traders evaluate probabilities and make decisions based on available market information. Successful trading is often about consistently making high-quality decisions rather than being right on every trade.
For beginners, the best approach is to keep things simple. Start by understanding the different chart types, identifying trends, recognizing support and resistance levels, and becoming familiar with various timeframes. As your experience grows, you can gradually explore more advanced concepts such as candlestick patterns, technical indicators, chart patterns, and market structure analysis.
It is also important to combine chart analysis with proper risk management. Even the most accurate chart analysis can fail if risk is not controlled. Using stop losses, managing position sizes, and maintaining realistic expectations are essential components of long-term trading success.
Like any skill, reading Forex charts requires patience, practice, and consistency. The more charts you study, the more comfortable you will become identifying market trends and recognizing potential trading opportunities. Over time, chart reading becomes second nature and serves as a powerful tool for making disciplined trading decisions.
Remember that successful traders are not necessarily those who predict every market move correctly. They are the traders who continuously learn, adapt, protect their capital, and follow a structured approach to the market. By developing strong chart-reading skills and combining them with sound risk management principles, you can build a solid foundation for your Forex trading journey.
Disclaimer
The information provided in this article is intended for educational and informational purposes only and should not be considered financial, investment, legal, or trading advice. The content is designed to help readers understand the fundamentals of Forex chart reading and does not constitute a recommendation to buy, sell, or hold any financial instrument.
Forex trading involves a high level of risk and may not be suitable for all investors. Currency markets can be highly volatile, and prices may fluctuate rapidly due to economic events, political developments, market sentiment, and other factors beyond anyone’s control. As a result, traders may lose part or all of their invested capital.
Past performance is not a guarantee of future results. Any examples, scenarios, or illustrations presented in this article are provided solely for educational purposes and should not be interpreted as promises or guarantees of future trading performance.
Readers are encouraged to conduct their own research, seek independent financial advice when appropriate, and carefully evaluate their financial situation, risk tolerance, and investment objectives before participating in Forex trading or any other financial market.
BuildSmartAfri and the author of this content assume no responsibility for any financial losses, damages, or decisions made based on the information provided in this article. Trading decisions should always be made independently and with a full understanding of the risks involved.
By reading and using the information contained in this article, you acknowledge that Forex trading carries inherent risks and that you are solely responsible for your own trading and investment decisions.