
Introduction:
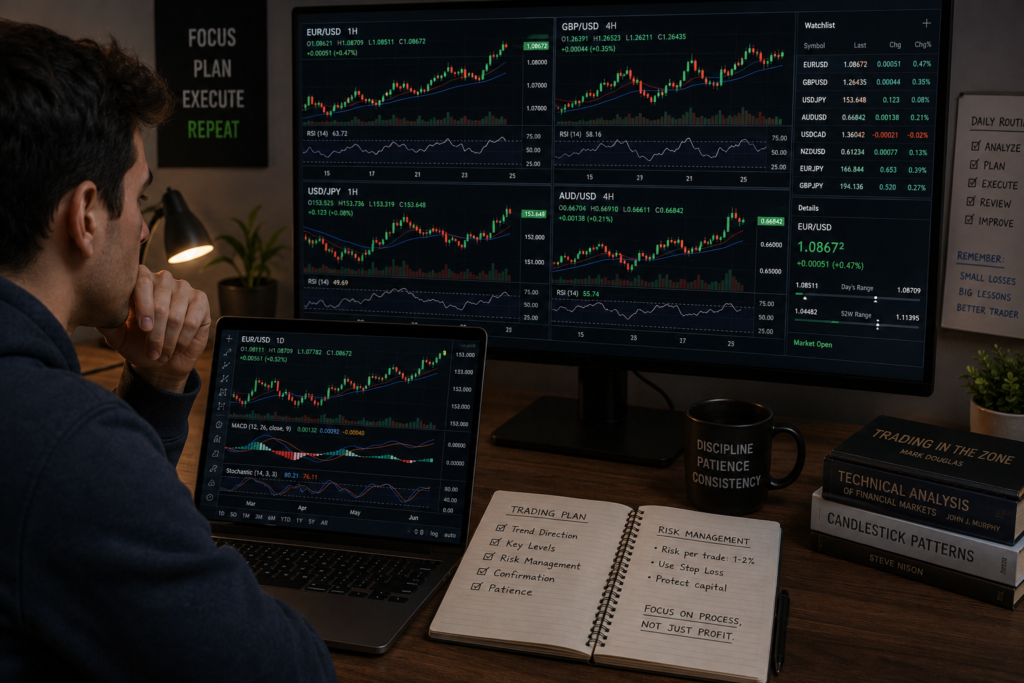
What Is Technical Analysis? A Beginner’s Guide to Reading Forex Charts. Every successful Forex trader relies on information to make trading decisions. One of the most popular methods of analyzing the market is technical analysis. Whether you are trading currencies, stocks, cryptocurrencies, or commodities, technical analysis provides a framework for understanding market movements and identifying potential trading opportunities. Learn the basics of Forex trading and technical analysis
For beginners, charts may look confusing at first. You may see candles moving up and down, colorful indicators, trend lines, and price levels that seem difficult to understand. However, once you learn the basics of technical analysis, these charts begin to tell a story about market behavior.
Technical analysis helps traders study historical price movements to predict potential future market direction. Instead of focusing on economic news or company performance, technical analysts focus on price action, chart patterns, trends, and trading indicators. Many beginners lose money because they trade without understanding the market. Avoid these common errors by reading our guide on Forex Trading Mistakes: 10 Costly Beginner Errors and How to Avoid Them.
In this beginner’s guide, you will learn what technical analysis is, how it works, the tools traders use, and how you can start applying it to your own Forex trading journey.
Table of content
Quick Summary
If you’re new to technical analysis, here are the key takeaways:
- Technical analysis studies historical price movements.
- Traders use charts to identify trends and opportunities.
- Support and resistance help identify important price levels.
- Candlestick patterns reveal market sentiment.
- Indicators such as RSI, MACD, and Moving Averages assist decision-making.
- Technical analysis is a skill that improves with practice.
- Risk management should always accompany technical analysis.
What Is Technical Analysis?
Technical analysis is the process of evaluating financial markets by studying historical price movements, trading volume, and market activity. Instead of focusing on economic reports, company earnings, or financial statements, technical analysts examine charts to identify patterns and trends that may provide clues about future price movements.
The core principle behind technical analysis is that market prices often move in recognizable patterns because human behavior tends to remain consistent over time. Emotions such as fear, greed, optimism, and uncertainty influence traders’ decisions, and these emotions are reflected in market prices. Since human psychology does not change significantly, similar market situations often produce similar price patterns.
Technical analysis is built on the belief that all available information affecting a market is already reflected in the current price. This information may include economic data, political events, interest rate decisions, market sentiment, and global news. Rather than trying to analyze every piece of information individually, technical analysts focus on the market’s reaction to that information as shown on a price chart.
For example, if a currency pair repeatedly falls to a specific price level and then rises again, traders may identify that level as a support zone. Similarly, if the price repeatedly struggles to move above a particular level, that area may become a resistance zone. These levels help traders determine potential entry points, exit points, stop-loss placements, and profit targets.
Technical analysis also helps traders answer important questions such as:
- Is the market trending upward, downward, or sideways?
- Where are potential buying opportunities?
- Where are potential selling opportunities?
- Is the current trend gaining strength or weakening?
- What price levels are important to watch?
To answer these questions, traders use various technical analysis tools, including:
- Price charts
- Trend lines
- Support and resistance levels
- Candlestick patterns
- Moving averages
- Relative Strength Index (RSI)
- MACD (Moving Average Convergence Divergence)
- Bollinger Bands
One of the biggest advantages of technical analysis is its versatility. The same principles can be applied across different financial markets, including Forex, stocks, cryptocurrencies, commodities, and indices. Whether you are analyzing the EUR/USD currency pair, gold prices, or a stock market index, the concepts of trends, support and resistance, and chart patterns remain largely the same.
Technical analysis is especially popular among Forex traders because the Forex market generates enormous amounts of price data every day. Since currency prices are constantly changing, traders can use charts and indicators to identify opportunities and make informed trading decisions. The Forex market’s high liquidity and continuous trading activity make it an ideal environment for technical analysis.
However, it is important to understand that technical analysis does not guarantee accurate predictions. No indicator or chart pattern can predict the future with complete certainty. Instead, technical analysis helps traders improve the probability of making better decisions by providing a structured approach to analyzing market behavior.
For beginners, technical analysis may seem complicated at first. However, by learning the fundamentals of chart reading, trends, support and resistance, and basic indicators, traders can gradually develop the skills needed to interpret market movements with greater confidence and consistency.
Why Technical Analysis Matters
Technical analysis matters because it gives traders a structured and objective way to understand the market and make informed decisions. Financial markets move continuously, and prices can change within seconds due to economic news, market sentiment, and the actions of millions of buyers and sellers around the world. Without a method of analyzing these movements, trading would largely become a process of guessing.
Technical analysis helps traders interpret market behavior by studying historical price movements and identifying patterns that may provide clues about future price direction. Instead of relying on emotions, rumors, or predictions from other people, traders use charts and technical tools to base their decisions on evidence and probability. Track important economic events that influence the Forex market
One of the biggest advantages of technical analysis is that it helps traders identify market trends. Knowing whether the market is moving upward, downward, or sideways allows traders to adapt their strategies accordingly. Trading in the direction of the prevailing trend often improves the probability of making successful trading decisions.
Technical analysis also helps traders identify potential entry points. Entering the market at the right time is important because it can significantly affect profitability and risk. By using tools such as support and resistance levels, trend lines, and candlestick patterns, traders can identify areas where buying or selling opportunities may emerge.
Equally important is knowing when to exit a trade. Many beginner traders focus heavily on finding entries but pay little attention to planning exits. Technical analysis helps traders determine logical profit targets and stop-loss levels, allowing them to protect their capital and manage their trades more effectively.
Another reason technical analysis matters is that it improves risk management. Successful trading is not about winning every trade; it is about controlling losses and protecting your trading account. Technical analysis provides traders with information that can help them place stop-loss orders, calculate potential risks, and determine appropriate position sizes.
Technical analysis also helps traders understand market sentiment. Every price movement represents the interaction between buyers and sellers. By studying price action and chart patterns, traders can gain insights into whether market participants are generally optimistic, pessimistic, or uncertain. Understanding market sentiment often helps traders anticipate potential market movements before they happen.
Technical analysis helps traders:
- Identify market trends and potential reversals
- Find high-probability entry opportunities
- Determine logical exit points
- Set stop-loss and take-profit levels
- Manage risk more effectively
- Understand market sentiment
- Reduce emotional decision-making
- Build consistency and trading discipline
It is important to understand that technical analysis does not predict the future with complete certainty. No indicator or chart pattern can guarantee profitable trades. Instead, technical analysis improves the probability of making better decisions by providing a systematic framework for analyzing market behavior.
For beginners, learning technical analysis is one of the most valuable investments they can make. It transforms trading from a process of guessing into a process of observing, analyzing, planning, and managing risk. Over time, the ability to read charts and understand market behavior can become a powerful skill that supports more confident and disciplined trading decisions.
Analyzing the market, traders would simply be guessing.
Technical analysis helps traders:
- Identify market trends
- Find potential entry points
- Determine exit points
- Manage risk effectively
- Understand market sentiment
- Improve trading discipline
Rather than relying on emotions, traders use technical analysis to make informed decisions based on market evidence.
How Technical Analysis Works
Technical analysis is built on a set of principles that help traders understand and interpret market behavior. Rather than relying on opinions, rumors, or predictions, technical analysts study price movements and chart patterns to identify potential trading opportunities.
At its core, technical analysis is based on three fundamental principles. These principles form the foundation of nearly every technical trading strategy used in the Forex market today.
1. The Market Discounts Everything
The first and most important principle of technical analysis is that the market price reflects all available information.
Technical analysts believe that every factor capable of influencing a currency pair is already incorporated into its current price. This includes:
- Economic news and reports
- Interest rate decisions
- Inflation data
- Political developments
- Geopolitical events
- Market sentiment
- Investor expectations
- Global economic conditions
For example, when a central bank announces an interest rate increase, thousands of traders and institutions immediately react to that information. Their buying and selling activity is reflected in the price movement of the affected currency pair.
Because of this, technical analysts focus less on the news itself and more on how the market responds to the news. They believe that the chart already contains the collective opinions, expectations, and reactions of market participants.
Consider a situation where positive economic news is released for a country’s currency. Many traders would expect the currency to strengthen. However, if the price falls instead of rising, the chart may reveal information that is not immediately obvious from the news alone. This is why technical analysts pay close attention to price action rather than relying solely on headlines.
In simple terms, technical analysts believe that the price chart tells the complete story of the market.
2. Prices Move in Trends
The second principle of technical analysis is that prices tend to move in trends rather than randomly.
A trend is the general direction in which a market is moving over a period of time. Understanding trends is one of the most important skills a trader can develop because trading in the direction of the trend often increases the probability of success.
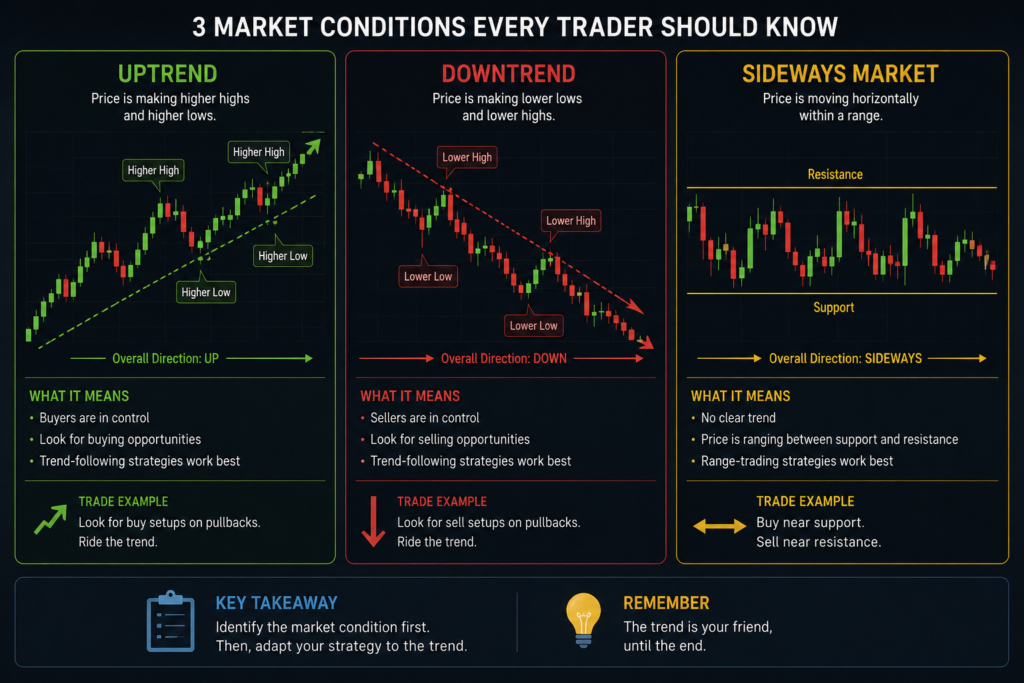
There are three main types of trends:
Uptrend
An uptrend occurs when prices consistently create:
- Higher highs
- Higher lows
This indicates that buyers are in control and demand is stronger than supply.
Downtrend
A downtrend occurs when prices consistently create:
- Lower highs
- Lower lows
This suggests that sellers are in control and supply is stronger than demand.
Sideways Trend (Range)
Sometimes the market moves within a relatively narrow range without a clear direction.
In a sideways market:
- Prices move between support and resistance levels.
- Neither buyers nor sellers have complete control.
- Trend-following strategies may become less effective.
One of the primary objectives of technical analysis is to identify the current market trend as early as possible. Traders can then use that information to align their trades with the dominant market direction.
There is a common saying among traders:
“The trend is your friend.”
This phrase emphasizes the importance of trading with the market’s momentum rather than constantly trying to predict reversals.
3. History Tends to Repeat Itself
The third principle of technical analysis is that history often repeats itself in financial markets.
This does not mean that prices will move exactly the same way every time. Instead, it means that human behavior tends to be consistent when faced with similar market conditions.
Financial markets are driven by emotions such as:
- Fear
- Greed
- Hope
- Excitement
- Uncertainty
Because these emotions remain relatively unchanged over time, traders often react similarly to recurring situations. As a result, certain price patterns and market behaviors appear repeatedly on charts.
For example:
- Traders often buy at support levels because they expect prices to rise.
- Traders often sell at resistance levels because they expect prices to fall.
- Strong trends frequently continue because traders follow momentum.
- Panic selling can occur when fear spreads through the market.
These repeated behaviors create recognizable chart patterns such as:
- Double Tops
- Double Bottoms
- Head and Shoulders
- Triangles
- Flags
- Bullish and Bearish Engulfing Patterns
Technical analysts study these patterns because they can provide clues about potential future price movements.
For instance, if a particular chart pattern has historically led to upward price movements, traders may look for similar outcomes when the pattern appears again.
While history does not repeat itself perfectly, it often rhymes. This principle allows traders to use past market behavior as a guide when evaluating current opportunities.
Bringing the Three Principles Together
The effectiveness of technical analysis comes from combining these three principles:
- The market price reflects all available information.
- Prices tend to move in identifiable trends.
- Human behavior creates recurring patterns in the market.
By understanding these concepts, traders can analyze charts more effectively and make decisions based on probabilities rather than emotions.
Although technical analysis cannot predict the future with complete certainty, it provides a structured framework for understanding market behavior and identifying potential trading opportunities. When combined with proper risk management and discipline, these principles can help traders navigate the Forex market with greater confidence and consistency.
Understanding Forex Charts
Charts are the foundation of technical analysis.
A chart displays the historical price movement of a currency pair over a specific period. Practice technical analysis using live market charts
Examples include:
- EUR/USD
- GBP/USD
- USD/JPY
- USD/CAD
Charts allow traders to identify patterns, trends, and important price levels. If you’re new to chart analysis, our guide on How to Read Forex Charts for Beginners explains candlesticks, timeframes, and price movements in greater detail.
Learning How to Read Forex Charts for Beginners is one of the most important steps in becoming a successful trader.
Types of Forex Charts
There are three main chart types used in technical analysis.
Line Chart
A line chart connects closing prices over time.
Advantages:
- Easy to understand
- Good for identifying overall trends
Disadvantages:
- Limited information
- Does not show intraday price movement
Bar Chart
A bar chart provides more information by showing:
- Opening price
- Closing price
- Highest price
- Lowest price
Candlestick Chart
Candlestick charts are the most popular chart type among Forex traders.
They provide detailed price information while remaining easy to read.
What Are Trends?
A trend is the general direction in which the market is moving over a period of time. In simple terms, a trend shows whether prices are generally rising, falling, or moving sideways. Understanding trends is one of the most important aspects of technical analysis because it helps traders understand the current market environment and make more informed trading decisions.
Rather than moving in a perfectly straight line, financial markets move in waves. Prices rise and fall continuously, creating patterns that traders can analyze. By studying these patterns, traders can determine whether buyers or sellers currently have more control over the market.
Recognizing trends is important because it allows traders to align their positions with the market’s momentum. Many experienced traders follow a simple principle:
“The trend is your friend.”
This means that trading in the direction of the prevailing trend often provides better opportunities than constantly trying to predict reversals.
There are three main types of market trends in Forex trading.
Uptrend
An uptrend occurs when prices are generally moving upward over time. In an uptrend, the market forms:
- Higher highs
- Higher lows
A higher high occurs when the market reaches a new peak that is above the previous peak. A higher low occurs when the market pulls back but remains above its previous low before continuing upward.
These higher highs and higher lows indicate that buyers are in control and demand is stronger than supply. This creates bullish market sentiment, meaning traders are generally optimistic and expect prices to continue rising.
For example, if the EUR/USD currency pair rises from 1.1000 to 1.1100, pulls back to 1.1050, and then climbs to 1.1200, the market is creating higher highs and higher lows. This is a classic example of an uptrend.
During an uptrend, many traders look for buying opportunities because trading in the direction of the trend may offer a higher probability of success.
Common characteristics of an uptrend include:
- Strong buying pressure
- Increasing prices over time
- Positive market sentiment
- Support levels gradually moving higher
- Traders looking for buying opportunities on pullbacks
Downtrend
A downtrend occurs when prices are generally moving downward over time. In a downtrend, the market forms:
- Lower highs
- Lower lows
A lower high occurs when the market attempts to rise but fails to exceed its previous peak. A lower low occurs when the market falls below its previous low.
These lower highs and lower lows indicate that sellers are dominating the market and supply is stronger than demand. This creates bearish market sentiment, meaning traders generally expect prices to continue falling.
For example, if GBP/USD falls from 1.3000 to 1.2900, rises slightly to 1.2950, and then drops further to 1.2800, the market is producing lower highs and lower lows, which signals a downtrend.
During downtrends, many traders focus on selling opportunities or wait for the trend to weaken before considering buy positions.
Common characteristics of a downtrend include:
- Strong selling pressure
- Declining prices over time
- Negative market sentiment
- Resistance levels gradually moving lower
- Traders looking for selling opportunities during temporary price rallies
Sideways Trend (Ranging Market)
A sideways trend, also known as a ranging market, occurs when prices move within a relatively narrow range without a clear upward or downward direction.
In this type of market:
- Prices repeatedly move between support and resistance levels.
- Buyers and sellers are relatively balanced.
- Neither side has complete control of the market.
For example, if USD/JPY repeatedly moves between 145.00 and 146.00 without breaking above or below these levels, the market is considered to be ranging.
Many beginner traders struggle during sideways markets because trend-following strategies become less effective. A trader may enter a position expecting a strong trend, only to see the market reverse repeatedly within the same price range.
However, sideways markets can still provide trading opportunities. Some traders specialize in range trading by buying near support levels and selling near resistance levels.
Common characteristics of sideways markets include:
- Lack of a clear trend
- Frequent price reversals
- Price movement within a defined range
- Uncertainty among market participants
- Increased likelihood of false breakouts
Why Understanding Trends Is Important
Trend identification is one of the foundations of technical analysis. Understanding market trends can help traders:
- Determine the overall market direction
- Identify high-probability trading opportunities
- Avoid trading against market momentum
- Improve entry and exit decisions
- Reduce emotional trading decisions
- Build more effective trading strategies
Although no trend lasts forever, learning how to identify and interpret trends can significantly improve a trader’s ability to understand market behavior and make more informed decisions.
For beginners, mastering trend analysis is one of the first and most valuable skills to develop. Once you learn to recognize uptrends, downtrends, and sideways markets, reading Forex charts becomes much easier and far less intimidating.
Support and Resistance Explained
Support and resistance are among the most important concepts in technical analysis. Support and resistance levels can also help traders place stop-loss orders and manage risk effectively. Learn more in What Is Risk Management in Forex?
What Is Support?
Support is a price level where buying pressure tends to increase.
When price reaches support, it often slows down or reverses upward.
Think of support as a floor beneath the market.
What Is Resistance?
Resistance is a price level where selling pressure tends to increase.
When price reaches resistance, it often slows down or reverses downward.
Think of resistance as a ceiling above the market.
Why They Matter
Support and resistance help traders:
- Identify entry points
- Set stop-loss levels
- Determine profit targets
Introduction to Candlestick Patterns
Candlesticks provide valuable information about market sentiment.
Each candlestick consists of:
- Open price
- Close price
- High price
- Low price
Bullish Candlestick
A bullish candlestick forms when the closing price is higher than the opening price.
This suggests buying pressure.
Bearish Candlestick
A bearish candlestick forms when the closing price is lower than the opening price.
This suggests selling pressure.
Popular Candlestick Patterns
- Doji
- Hammer
- Shooting Star
- Bullish Engulfing
- Bearish Engulfing
These patterns help traders anticipate potential market reversals or continuations.
Popular Technical Indicators
Indicators are mathematical calculations based on price data. Understanding price movements also requires knowing how pips work. Read our beginner-friendly guide on What Is a Pip in Forex?
They help traders analyze market conditions.
Moving Average (MA)
Moving averages smooth price data to identify trends.
Benefits:
- Identifies trend direction
- Filters market noise
Relative Strength Index (RSI)
RSI measures momentum.
Typically:
- Above 70 = Overbought
- Below 30 = Oversold
MACD
The Moving Average Convergence Divergence (MACD) helps traders identify:
- Trend strength
- Momentum shifts
- Potential reversals
Bollinger Bands
Bollinger Bands measure market volatility.
They help traders identify periods of high and low volatility.
Combining Technical Analysis Tools
One common beginner mistake is relying on a single indicator.
Professional traders often combine multiple tools.
Example:
- Trend identified using Moving Average
- Support level confirms entry
- RSI confirms momentum
- Stop-loss protects capital
Using multiple confirmations can improve decision quality.
However, avoid using too many indicators, as this can create confusion.
Common Technical Analysis Mistakes
Many beginners misuse technical analysis.
Common mistakes include:
Overloading Charts
Adding too many indicators creates conflicting signals.
Ignoring Risk Management
Even strong setups can fail.
Always use proper risk management.
Trading Against the Trend
Beginners often attempt to predict reversals too early.
Trading with the trend generally offers better probabilities.
Focusing on Perfection
No indicator is perfect.
Technical analysis improves probabilities rather than guaranteeing outcomes.
Advantages of Technical Analysis
Technical analysis offers several benefits:
- Easy access to chart data
- Works across multiple markets
- Helps identify trends
- Supports disciplined decision-making
- Can be combined with risk management
Limitations of Technical Analysis
Despite its usefulness, technical analysis has limitations.
- No indicator predicts the future with certainty.
- Unexpected news can impact markets.
- False signals can occur.
- Market conditions constantly change.
For this reason, traders should combine technical analysis with sound risk management practices.
A Beginner’s Roadmap for Learning Technical Analysis
Step 1: Learn Chart Basics
Understand:
- Candlesticks
- Trends
- Support and resistance
Step 2: Practice Chart Reading
Spend time analyzing charts daily.
Observe how price behaves around key levels.
Step 3: Learn One Indicator at a Time
Start with:
- Moving Average
- RSI
- MACD
Avoid trying to master everything at once.
Step 4: Use a Demo Account
Practice your analysis without risking real money.
Step 5: Build a Trading Plan
Develop clear rules for:
- Entries
- Exits
- Risk management
Frequently Asked Questions
Is technical analysis useful for beginners?
Yes. Technical analysis provides a structured way for beginners to understand market movements and make informed trading decisions.
Can technical analysis predict the market?
No. Technical analysis helps identify probabilities, not certainties.
Which chart type is best for beginners?
Candlestick charts are generally considered the best option because they provide detailed information while remaining easy to read.
Do professional traders use technical analysis?
Yes. Many professional traders use technical analysis alongside risk management and market research.
How long does it take to learn technical analysis?
Learning the basics can take a few weeks, but mastering technical analysis often takes months or years of practice and experience.
Final Thoughts
Technical analysis is one of the most valuable skills a Forex trader can develop. It helps traders understand market behavior, identify trends, recognize trading opportunities, and make more informed decisions.
While technical analysis may seem overwhelming at first, every successful trader started as a beginner. By learning chart basics, understanding support and resistance, studying candlestick patterns, and practicing with indicators, you can gradually build confidence and improve your market analysis skills.
Remember that technical analysis is not about predicting the future perfectly. Instead, it is about improving the probability of making better trading decisions. When combined with proper risk management, patience, and discipline, technical analysis can become a powerful tool in your Forex trading journey.
Focus on learning one concept at a time, practice consistently, and continue developing your skills. Over time, the charts that once seemed confusing will begin to tell a story that helps guide your trading decisions.
Disclaimer
The information provided in this article is for educational purposes only and should not be considered financial or investment advice. Forex trading involves substantial risk and may not be suitable for all investors. Always conduct your own research and consult a qualified financial professional before making financial decisions. Never trade with money you cannot afford to lose.